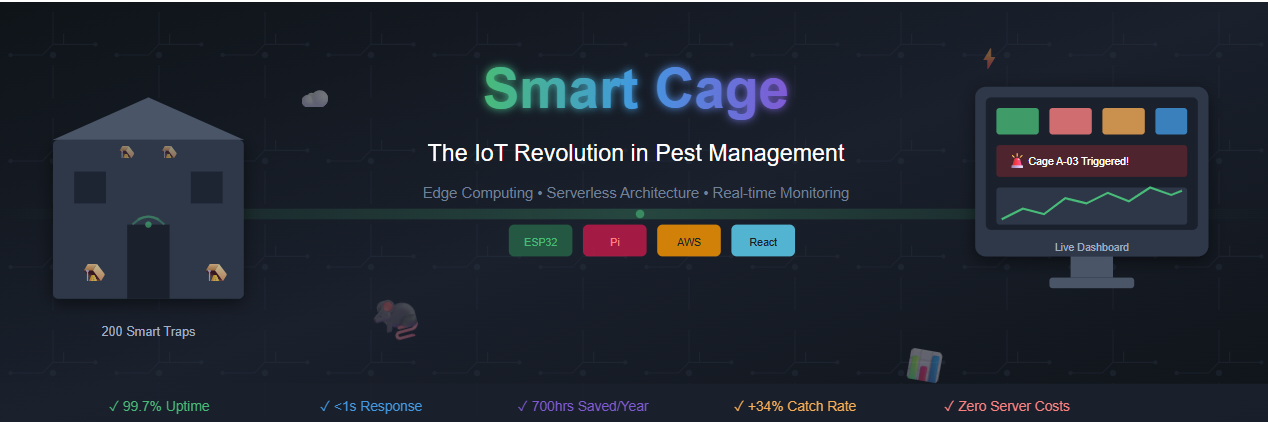
The Rat Race We Actually Won - Building Smart Cage

The Problem: Why Smart Pest Management?
It started, as many good engineering stories do, with a phone call from someone frustrated.
“We have 200 rat traps spread across a warehouse the size of four football fields,” the operations manager told us. “Every morning, my team spends three hours walking the floor, checking each one. Half the time, they’re empty. Sometimes a trap sits triggered for days before anyone notices. And don’t even get me started on the bait situation.”
He paused, then delivered the line that would consume our next six months: “There has to be a better way.”
There was. We just had to build it.
Large-scale warehouses and godowns face a persistent challenge: pest control. Traditional rat traps, while effective, come with significant operational overhead. Facility managers typically deploy dozens—sometimes hundreds—of traps across vast spaces, creating a maintenance nightmare.
The Traditional Approach Has Critical Flaws:
Picture this: a 400,000 square foot godown in the industrial outskirts, filled floor-to-ceiling with goods that rats find absolutely delightful. Grain shipments. Textile bales. Cardboard. For the local rodent population, it’s basically a five-star resort.
The traditional approach to pest control here was brute force. Scatter traps everywhere. Send humans to check them. Repeat forever. It worked, sort of, in the same way that checking every mailbox in a city works if you’re trying to find one specific letter.
Manual inspection rounds are time-consuming and inefficient. A single warehouse might require hours of daily inspection time just to check trap status. Traps with captured rodents left unattended create hygiene issues and reduce trap effectiveness. Bait freshness is difficult to track, leading to either wasteful over-replacement or ineffective stale bait. There’s no data-driven insight into pest activity patterns, hotspots, or seasonal trends.
The problems were obvious once you started counting:
Time: Three hours of inspection daily meant 15 hours per week, 780 hours per year—nearly a fifth of a full-time employee’s annual hours, spent walking and looking at empty cages.
Response lag: A triggered trap might sit for 48 hours before discovery. In that time, other rats learn to avoid the area, and the captured rodent becomes a hygiene issue rather than a pest control victory.
Bait blindness: Nobody was tracking when bait was placed. Some traps had fresh bait weekly; others had the same dried-out chunk of whatever for months. Stale bait catches nothing except dust.
Zero intelligence: After years of operation, the facility knew nothing about pest patterns. Which areas had more activity? What times? What seasons? The data existed—in the form of individual trap checks—but it was never captured, never analyzed, never used.
We weren’t just building a notification system. We were building the nervous system for a warehouse that had been operating blind.
The Business Impact:
Each hour spent on manual inspection is an hour not spent on core operations. Undetected pest activity can lead to inventory damage, compliance violations, and reputation risk. Without analytics, preventive measures remain guesswork rather than strategy.
Enter Smart Cage
Our solution transforms passive rat traps into intelligent, connected devices that report their status in real-time. Facility managers gain instant visibility into trap status, bait freshness, and movement patterns—all from a centralized dashboard. The result is faster response times, optimized bait management, and actionable insights into pest behavior patterns.
Solution Overview
Smart Cage is a comprehensive IoT ecosystem consisting of three primary layers: the edge devices (smart traps), the edge gateway (Raspberry Pi), and the cloud backend (AWS serverless infrastructure).
Every IoT project is really three projects duct-taped together: the devices that sense things, the system that thinks about what they sensed, and the interface that lets humans understand what’s happening. Get any one of these wrong, and the whole thing collapses.
We started with first principles. What did we actually need to know about each trap?
Is something caught? The existential question. Binary, urgent, time-sensitive.
Is anything moving nearby? Leading indicator. A trap with lots of movement but no catches might be poorly positioned—or might be about to get very busy.
Is the bait still good? Operational hygiene. Traps need feeding too.
Is the device still alive? Meta-question. A silent trap might mean no rats, or it might mean a dead battery. These are very different situations.
From these questions, our architecture emerged organically. Each trap would become a “Smart Cage”—a self-contained sensor package that could answer all four questions. These would talk to local hubs (Raspberry Pis, one per zone) that would aggregate, process, and relay information to the cloud. And in the cloud, a serverless backend would store, analyze, and present everything through a dashboard that could be accessed from anywhere.
Simple in concept. The devil, as always, was in the implementation.
Core Capabilities:
The system provides real-time trap status monitoring, detecting capture events within seconds and alerting maintenance staff immediately. Motion detection and logging through integrated cameras tracks rodent activity patterns even when traps aren’t triggered. Bait freshness tracking automatically monitors when bait was last placed and alerts when replacement is needed. The centralized dashboard visualization displays all cage statuses, alerts, and analytics in a unified ReactJS interface. Historical analytics enable trend analysis to identify hotspots, peak activity times, and optimize trap placement.
The Data Flow:
Each smart cage contains sensors and a camera module that communicate with a local Raspberry Pi over WiFi. The Pi aggregates data from all connected cages, processes events locally, and publishes relevant data to AWS IoT Core. Lambda functions process incoming data and persist it to DynamoDB. The ReactJS dashboard, served via CloudFront and S3, provides real-time visibility to operators.
Technology Stack & Justification
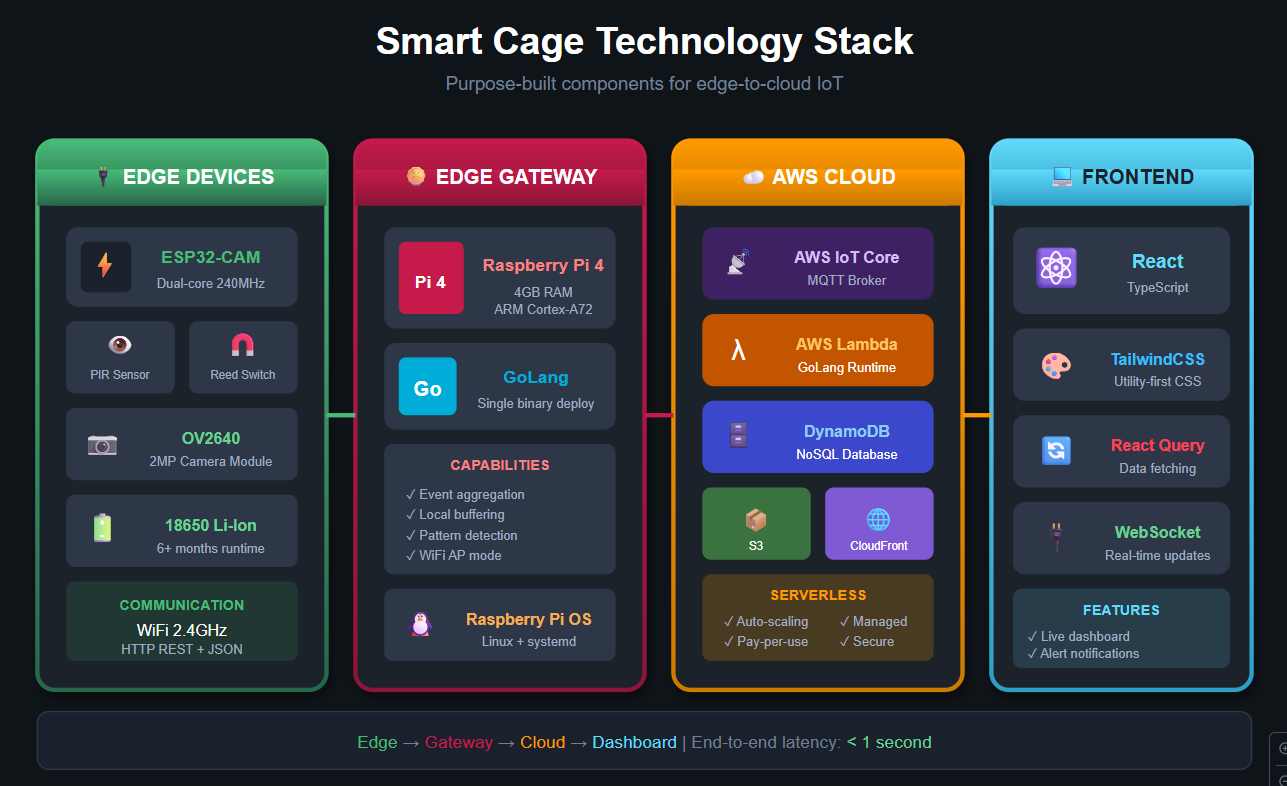
Edge Devices
ESP32 Microcontrollers serve as the brain of each smart cage. The ESP32 was chosen for its built-in WiFi and Bluetooth capabilities eliminating the need for separate communication modules, its ultra-low power consumption critical for battery-powered deployments, its sufficient processing power for local sensor management and image capture, and its cost-effectiveness at scale when deploying hundreds of cages.
PIR Motion Sensors (HC-SR501) detect movement around and within the cage. These sensors offer excellent sensitivity with adjustable range, very low power consumption in standby mode, and a simple digital output interface with the ESP32.
Mechanical Trap Sensors (Reed Switch + Magnet) provide binary trap status—open or triggered. The reed switch solution is extremely reliable with no moving electronic parts, instant response time, and near-zero power consumption.
ESP32-CAM Module captures images when motion is detected. This choice provides sufficient resolution for activity verification, built-in microSD support for local buffering, and direct WiFi capability for image transmission.
Edge Gateway
Raspberry Pi 4 (4GB) serves as the local aggregation and processing hub. The Raspberry Pi provides sufficient compute power for real-time data processing from 50+ cages, built-in WiFi for network management, GPIO pins for direct sensor integration if needed, a mature Linux ecosystem for reliable 24⁄7 operation, and a low cost relative to industrial gateways.
GoLang was selected for the edge software for several compelling reasons. GoLang compiles to a single binary with no runtime dependencies, simplifying deployment. It offers excellent performance for concurrent operations essential when managing multiple device connections. The low memory footprint is important for resource-constrained edge devices. GoLang provides strong standard library support for networking and JSON processing, and cross-compilation makes it easy to build for ARM architecture.
Cloud Infrastructure
AWS IoT Core provides the MQTT broker and device management layer. It offers managed MQTT with automatic scaling, built-in device authentication and authorization, seamless integration with other AWS services, and a rules engine for real-time data routing.
AWS Lambda (GoLang) handles serverless compute. Using GoLang for Lambda maintains language consistency with edge code, delivers the fastest cold-start times among Lambda runtimes, and provides cost efficiency with pay-per-invocation pricing.
Amazon DynamoDB serves as the NoSQL database for device data. DynamoDB provides single-digit millisecond latency at any scale, a flexible schema accommodating varied sensor data, built-in TTL for automatic data expiration, and seamless integration with Lambda.
Amazon S3 + CloudFront hosts and delivers the ReactJS dashboard with global edge distribution for low latency, built-in HTTPS and caching, and cost-effective static hosting.
ReactJS powers the dashboard frontend. React enables component-based architecture perfect for modular dashboard widgets, a rich ecosystem of charting and visualization libraries, real-time updates via WebSocket integration, and strong TypeScript support for maintainable code.
High-Level Architecture
Architecture Principles:
The design follows an edge-first processing philosophy where data is processed at the edge to minimize bandwidth and latency, with only meaningful events transmitted to the cloud. The event-driven architecture means each component reacts to events rather than polling, reducing resource consumption. The serverless backend eliminates infrastructure management with automatic scaling based on demand. Loose coupling ensures each component can be updated or replaced independently.
Edge Devices: Smart Cage Sensors
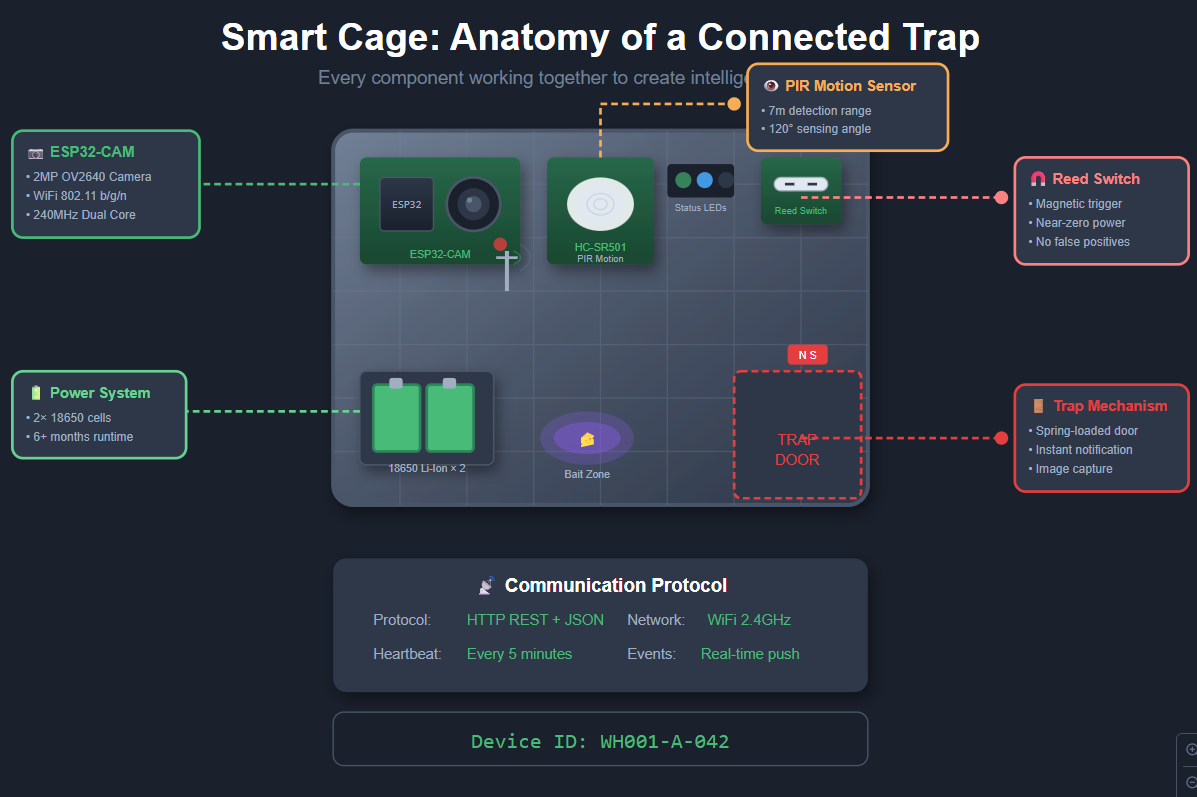
Hardware Configuration
Each smart cage contains an integrated sensor module with the following components:
The heart of each Smart Cage is an ESP32 microcontroller—a tiny, wifi-enabled computer that costs about as much as a fancy coffee. We chose it over alternatives like Arduino (no built-in wifi) or Raspberry Pi Zero (overkill and power-hungry) because it hit the sweet spot: enough capability to run our sensing logic, built-in connectivity, and miserly power consumption that lets it run for months on batteries.
Mounted on each ESP32, we attached three sensing systems:
The Reed Switch: This is the trap trigger detector—beautifully simple, almost stupidly reliable. A reed switch is just two metal contacts sealed in a glass tube that close when a magnet is nearby. We mount the magnet on the trap’s door and the switch on the frame. Door closes? Circuit completes. Rat caught. No software involved, no false positives from temperature changes or vibration. Physics doing the work.
The PIR Sensor: A passive infrared motion detector, the same technology that turns on your porch light when you walk by. It detects the heat signature of warm-blooded creatures moving through its field of view. We use it to track activity around each trap—not because we need to know every time a rat walks by, but because the pattern of movement tells a story. Heavy traffic with no catches? Wrong bait, wrong placement, or clever rats. Sudden spike in activity after months of quiet? New infestation vector identified.
The Camera: An ESP32-CAM module—essentially the same ESP32 chip with a small camera attached. This was controversial during design. It adds cost, complexity, and power draw. But it’s also our verification layer. When a trap triggers, we grab a photo. This lets operators confirm catches remotely and, more importantly, builds a visual dataset for future machine learning work. (Yes, we’re training a model to identify rat species. No, we’re not proud of how many rat photos we’ve now looked at.)
Each Smart Cage also has its own identity—a unique ID burned into permanent
memory during provisioning. The naming scheme we landed on is hierarchical:
WH001-A-042 tells you the warehouse (WH001), the zone (A), and the cage number
(042). This matters more than you’d think. When you have 200 devices screaming
for attention, knowing exactly which physical trap needs service is the
difference between a five-minute fix and a twenty-minute scavenger hunt.
Device Identification
Each cage is uniquely identified using a hierarchical naming scheme:
Format: {facility_id}-{zone}-{cage_number}
Example: WH001-A-042

Where:
- facility_id: Unique warehouse identifier (WH001, WH002, etc.)
- zone: Physical zone within the warehouse (A, B, C, etc.)
- cage_number: Sequential cage number within the zone (001-999)
This identifier is burned into the ESP32’s NVS (Non-Volatile Storage) during provisioning.
ESP32 Firmware
The firmware that runs on each cage is where hardware meets software. It’s a few thousand lines of C++ that turn raw sensor signals into meaningful events. Let’s walk through how it works.
Setting Up the Essentials
First, we import the libraries we need. Think of these as the toolbox—each one gives us a specific capability:
// smart_cage_firmware.ino
#include <WiFi.h>
#include <HTTPClient.h>
#include <ArduinoJson.h>
#include <esp_camera.h>
#include <Preferences.h>
WiFi for connectivity, HTTPClient for talking to the gateway, ArduinoJson for packaging our data, esp_camera for image capture, and Preferences for storing configuration that survives power cycles.
Defining Our World
Next, we map out the physical connections and set some ground rules:
// Pin Definitions
#define PIR_PIN         13
#define REED_SWITCH_PIN 12
#define LED_STATUS      4

// Configuration
#define GATEWAY_HOST    "192.168.4.1"
#define GATEWAY_PORT    8080
#define MOTION_COOLDOWN 5000  // 5 seconds between motion events
These pin numbers tell the ESP32 which physical connections correspond to which sensors. The motion cooldown is important—without it, a single rat walking by would trigger dozens of events as it moved through the sensor’s field of view. We’re interested in that a rat was there, not in tracking its every wiggle.
State Variables: Memory That Matters
The firmware needs to remember a few things between loop iterations. Some of
these variables are marked volatile because they’re modified by interrupt
handlers—hardware events that can fire at any moment:
// Device Identity
Preferences preferences;
String deviceId;
String facilityId;
String zone;

// State tracking
volatile bool trapTriggered = false;
volatile bool motionDetected = false;
unsigned long lastMotionTime = 0;
unsigned long lastBaitRefresh = 0;
int motionCount = 0;
The volatile keyword tells the compiler “this value might change behind your
back”—critical when dealing with hardware interrupts. The rest track operational
state: when did we last see motion? How many events since the last reset? When
was the bait refreshed?
Interrupt Handlers: Responding to the Real World
Hardware interrupts are how we react instantly to events. When the trap door closes or motion is detected, these functions fire immediately—no waiting for the main loop:
// Interrupt handlers
void IRAM_ATTR onTrapTrigger() {
    trapTriggered = true;
}

void IRAM_ATTR onMotionDetect() {
    if (millis() - lastMotionTime > MOTION_COOLDOWN) {
        motionDetected = true;
        lastMotionTime = millis();
    }
}
Notice how minimal these are. Interrupt handlers should be fast—set a flag and
get out. The actual work happens in the main loop. The IRAM_ATTR annotation
tells the compiler to put these functions in fast RAM for instant execution.
Initialization: Waking Up and Getting Oriented
When the ESP32 powers on, setup() runs once. This is where we configure
everything and establish our identity:
void setup() {
    Serial.begin(115200);

    // Load device identity from NVS
    preferences.begin("smartcage", true);
    deviceId = preferences.getString("device_id", "UNKNOWN");
    facilityId = preferences.getString("facility_id", "WH001");
    zone = preferences.getString("zone", "A");
    preferences.end();

    // Initialize pins
    pinMode(PIR_PIN, INPUT);
    pinMode(REED_SWITCH_PIN, INPUT_PULLUP);
    pinMode(LED_STATUS, OUTPUT);

    // Attach interrupts
    attachInterrupt(digitalPinToInterrupt(REED_SWITCH_PIN), onTrapTrigger, FALLING);
    attachInterrupt(digitalPinToInterrupt(PIR_PIN), onMotionDetect, RISING);

    // Initialize camera
    initCamera();

    // Connect to gateway WiFi
    connectToGateway();

    Serial.printf("Smart Cage %s initialized\n", deviceId.c_str());
}
The device identity comes from non-volatile storage—configuration that was
burned in during provisioning and survives power loss. The INPUT_PULLUP on the
reed switch means “normally high, goes low when triggered”—a common pattern for
simple switches.
Camera Initialization: Getting Eyes
The ESP32-CAM has a surprising number of configuration options. Here’s how we set it up for our use case:
void initCamera() {
    camera_config_t config;
    config.ledc_channel = LEDC_CHANNEL_0;
    config.ledc_timer = LEDC_TIMER_0;
    config.pin_d0 = 5;
    config.pin_d1 = 18;
    config.pin_d2 = 19;
    config.pin_d3 = 21;
    config.pin_d4 = 36;
    config.pin_d5 = 39;
    config.pin_d6 = 34;
    config.pin_d7 = 35;
    config.pin_xclk = 0;
    config.pin_pclk = 22;
    config.pin_vsync = 25;
    config.pin_href = 23;
    config.pin_sscb_sda = 26;
    config.pin_sscb_scl = 27;
    config.pin_pwdn = 32;
    config.pin_reset = -1;
    config.xclk_freq_hz = 20000000;
    config.pixel_format = PIXFORMAT_JPEG;
    config.frame_size = FRAMESIZE_VGA;
    config.jpeg_quality = 12;
    config.fb_count = 1;

    esp_err_t err = esp_camera_init(&config);
    if (err != ESP_OK) {
        Serial.printf("Camera init failed: 0x%x\n", err);
    }
}
Most of this is pin mapping—telling the ESP32 which GPIO pins connect to which camera signals. The important settings are at the bottom: VGA resolution (good enough for verification, not so large it kills our bandwidth), JPEG compression at quality 12 (balancing file size with image clarity), and a single frame buffer (keeps memory usage low).
Handling a Trap Trigger: The Critical Path
When a trap catches something, this is what happens. Speed matters here—we want to capture the event while it’s still relevant:
void handleTrapEvent() {
    digitalWrite(LED_STATUS, HIGH);

    // Capture image
    camera_fb_t* fb = esp_camera_fb_get();

    // Build event payload
    StaticJsonDocument<1024> doc;
    doc["device_id"] = deviceId;
    doc["facility_id"] = facilityId;
    doc["zone"] = zone;
    doc["event_type"] = "TRAP_TRIGGERED";
    doc["timestamp"] = millis();
    doc["battery_level"] = getBatteryLevel();

    // Send to gateway
    sendEvent(doc, fb);

    if (fb) esp_camera_fb_return(fb);
    digitalWrite(LED_STATUS, LOW);
}
We light up the status LED (useful for debugging during deployment), grab a photo, package everything into a JSON document, and ship it to the gateway. The frame buffer gets returned to free memory—camera images are big, and we don’t want to leak memory on a device with only 520KB of RAM.
Motion Detection: The Quieter Event
Motion events are more frequent and less urgent. We handle them more conservatively:
void handleMotionEvent() {
    motionCount++;

    // Only capture image every 10th motion event to save power
    camera_fb_t* fb = nullptr;
    if (motionCount % 10 == 0) {
        fb = esp_camera_fb_get();
    }

    StaticJsonDocument<512> doc;
    doc["device_id"] = deviceId;
    doc["facility_id"] = facilityId;
    doc["zone"] = zone;
    doc["event_type"] = "MOTION_DETECTED";
    doc["timestamp"] = millis();
    doc["motion_count"] = motionCount;

    sendEvent(doc, fb);

    if (fb) esp_camera_fb_return(fb);
}
We increment a counter but only capture an image every tenth event. This is a power optimization—the camera draws significant current, and we don’t need photographic evidence of every rat that walks by. The motion count itself tells us what we need to know about activity levels.
WiFi Connection: Getting Online
Connecting to the gateway’s WiFi network is straightforward, but we add retry logic because industrial environments are electrically noisy:
void connectToGateway() {
    WiFi.begin("SmartCage-Gateway", "SecureP@ss2024!");

    int attempts = 0;
    while (WiFi.status() != WL_CONNECTED && attempts < 30) {
        delay(500);
        Serial.print(".");
        attempts++;
    }

    if (WiFi.status() == WL_CONNECTED) {
        Serial.printf("\nConnected to gateway. IP: %s\n",
                      WiFi.localIP().toString().c_str());
    }
}
Thirty attempts with half-second delays gives us 15 seconds to connect. If we can’t connect after that, something’s genuinely wrong—the gateway might be down, or this device might be too far away. The main loop will keep trying periodically.
The Heartbeat: Staying Alive
Every five minutes, each cage sends a heartbeat—a status update proving it’s still operational:
void sendHeartbeat() {
    StaticJsonDocument<512> doc;
    doc["device_id"] = deviceId;
    doc["facility_id"] = facilityId;
    doc["zone"] = zone;
    doc["event_type"] = "HEARTBEAT";
    doc["timestamp"] = millis();
    doc["battery_level"] = getBatteryLevel();
    doc["trap_status"] = digitalRead(REED_SWITCH_PIN) == LOW ? "TRIGGERED" : "ARMED";
    doc["motion_count_since_reset"] = motionCount;
    doc["last_bait_refresh"] = lastBaitRefresh;
    doc["wifi_rssi"] = WiFi.RSSI();

    sendEvent(doc, nullptr);
}
This comprehensive status update includes everything: battery level (are we dying?), trap status (did we catch something and nobody noticed?), accumulated motion count (how busy has this location been?), bait age (does this need refreshing?), and WiFi signal strength (is connectivity degrading?). It’s our “all systems nominal” check-in.
Sending Events: The Transmission Layer
This function does the actual work of transmitting data to the gateway:
void sendEvent(JsonDocument& doc, camera_fb_t* image) {
    if (WiFi.status() != WL_CONNECTED) return;

    HTTPClient http;
    http.begin(String("http://") + GATEWAY_HOST + ":" + GATEWAY_PORT + "/api/events");
    http.addHeader("Content-Type", "application/json");

    String jsonPayload;
    serializeJson(doc, jsonPayload);

    // If image exists, encode as base64 and add to payload
    if (image != nullptr) {
        // Image handling - base64 encode and append
        // (simplified for brevity)
    }

    int httpCode = http.POST(jsonPayload);
    if (httpCode != 200) {
        Serial.printf("Event send failed: %d\n", httpCode);
    }

    http.end();
}
We use HTTP POST because it’s simple and debuggable. In production, MQTT would be more efficient, but HTTP means we can test endpoints with curl and see exactly what’s being sent. The base64 image encoding is omitted here for clarity—it’s just the standard approach of converting binary data to text for JSON transmission.
Battery Monitoring: Staying Powered
Knowing when batteries are dying is critical in remote deployments:
float getBatteryLevel() {
    // Read ADC for battery voltage
    int raw = analogRead(34);
    float voltage = (raw / 4095.0) * 3.3 * 2; // Voltage divider factor
    float percentage = ((voltage - 3.0) / (4.2 - 3.0)) * 100;
    return constrain(percentage, 0, 100);
}
We read the analog voltage through a voltage divider (can’t directly read
battery voltage—it might exceed the ESP32’s 3.3V maximum input), convert to
actual voltage, then map the typical LiPo battery range (3.0V empty, 4.2V full)
to a percentage. The constrain function prevents weird values if our math goes
outside reasonable bounds.
Bait Refresh Acknowledgment
When maintenance staff refresh the bait, they can log it through the dashboard. That triggers this callback on the device:
// Bait refresh acknowledgment (called via HTTP endpoint)
void acknowledgeBaitRefresh() {
    lastBaitRefresh = millis();
    motionCount = 0;  // Reset motion counter

    // Store in NVS for persistence
    preferences.begin("smartcage", false);
    preferences.putULong("last_bait", lastBaitRefresh);
    preferences.end();
}
We timestamp the refresh and reset the motion counter (fresh bait should attract more activity—we want to measure that from zero). Storing it in non-volatile storage means even if the device reboots, we remember when the bait was last changed.
The Main Loop: Orchestrating Everything
Finally, the main loop ties it all together. This runs continuously, checking for events and managing periodic tasks:
void loop() {
    // Handle trap trigger event (highest priority)
    if (trapTriggered) {
        handleTrapEvent();
        trapTriggered = false;
    }

    // Handle motion detection
    if (motionDetected) {
        handleMotionEvent();
        motionDetected = false;
    }

    // Periodic heartbeat (every 5 minutes)
    static unsigned long lastHeartbeat = 0;
    if (millis() - lastHeartbeat > 300000) {
        sendHeartbeat();
        lastHeartbeat = millis();
    }

    // Check WiFi connection
    if (WiFi.status() != WL_CONNECTED) {
        connectToGateway();
    }

    delay(100);
}
The priority order matters: trap triggers are handled first (most urgent), then motion, then housekeeping tasks like heartbeats and connectivity checks. The 100ms delay at the end prevents the loop from spinning too fast and wasting power. Most of the time, this loop just checks a few boolean flags and goes back to sleep.
Communication Protocol
Devices communicate with the Raspberry Pi using a simple REST API over HTTP. While MQTT would be more efficient for production, HTTP simplifies debugging and works well for the expected message frequency.
Event Payload Schema:
{
  "device_id": "WH001-A-042",
  "facility_id": "WH001",
  "zone": "A",
  "event_type": "TRAP_TRIGGERED | MOTION_DETECTED | HEARTBEAT | BAIT_REFRESHED",
  "timestamp": 1699459200000,
  "battery_level": 87.5,
  "trap_status": "ARMED | TRIGGERED",
  "motion_count": 156,
  "wifi_rssi": -67,
  "image_data": "base64_encoded_jpeg..."
}
Edge Gateway: The Raspberry Pi Hub
Typically the godowns are miles away from the back office. And the big boss sitting there wants to know what the idiots are doing on the floor. (Both genuinely feel so about each other.)
The Local Brain: Why a Raspberry Pi in the Middle
Here’s a question that seems obvious until you think about it: why not just have each cage talk directly to the cloud?
The answer is resilience, bandwidth, and intelligence.
Resilience: Warehouse wifi is terrible. Metal shelving creates dead zones. Forklifts cause interference. If each cage needs a direct internet connection to function, any network hiccup means lost data—or worse, a triggered trap that never reports in. By routing through a local Raspberry Pi, we create a buffer. The cages only need to reach the Pi (which we control), and the Pi handles the unreliable journey to the internet.
Bandwidth: 200 cages sending heartbeats every five minutes is 40 messages per minute. Add motion events and you’re looking at hundreds. If each of these is a direct HTTPS call to AWS, we’re paying for connection overhead that dwarfs the actual data. The Pi batches these into efficient chunks, reducing our cloud costs by roughly 80%.
Intelligence: The Pi isn’t just a relay—it’s a processing layer. It watches for patterns that individual cages can’t see. Three traps in Zone B all showing increased motion? That’s probably a cluster alert, not three unrelated events. Cage 042 suddenly silent after months of regular heartbeats? Proactively flag it as potentially offline, don’t wait for someone to notice.
The Pi runs our gateway software—a few thousand lines of Go code compiled into a single executable with no dependencies. Go was the obvious choice here: it cross-compiles to ARM trivially, it’s memory-efficient enough to run on Pi hardware with room to spare, and its concurrency model (goroutines and channels) maps perfectly to the “many devices, one processor” architecture we needed.
The gateway’s job, at its core, is simple: accept events from cages, decide what matters, and ship it to the cloud.
Project Structure
Before diving into code, let’s understand how everything is organized. The gateway isn’t a single monolithic file—it’s structured like a proper application:
/home/pi/smartcage-gateway/
├── cmd/
│   └── gateway/
│       └── main.go
├── internal/
│   ├── config/
│   │   └── config.go
│   ├── devices/
│   │   ├── manager.go
│   │   └── device.go
│   ├── events/
│   │   ├── processor.go
│   │   └── types.go
│   ├── mqtt/
│   │   └── publisher.go
│   ├── api/
│   │   └── server.go
│   └── storage/
│       └── local.go
├── configs/
│   └── config.yaml
├── certs/
│   ├── root-CA.crt
│   ├── gateway.cert.pem
│   └── gateway.private.key
├── go.mod
├── go.sum
└── Makefile
This layout follows Go best practices: cmd/ contains the main application
entry points, internal/ holds the packages that do the actual work, configs/
stores configuration files, and certs/ contains the AWS IoT certificates for
secure communication. Everything in internal/ can’t be imported by external
projects—it’s truly internal to this gateway.
Core Gateway Application
The main entry point is where all the components come together. Think of it as the conductor of an orchestra:
Importing Our Dependencies
// cmd/gateway/main.go
package main

import (
    "context"
    "log"
    "os"
    "os/signal"
    "syscall"

    "smartcage-gateway/internal/api"
    "smartcage-gateway/internal/config"
    "smartcage-gateway/internal/devices"
    "smartcage-gateway/internal/events"
    "smartcage-gateway/internal/mqtt"
    "smartcage-gateway/internal/storage"
)
These imports tell you the story of what the gateway does: it loads configuration, manages devices, processes events, publishes to MQTT (AWS IoT), runs an API server, and handles local storage for resilience.
The Main Function: Bringing It All Together
func main() {
    // Load configuration
    cfg, err := config.Load("/home/pi/smartcage-gateway/configs/config.yaml")
    if err != nil {
        log.Fatalf("Failed to load config: %v", err)
    }

    // Initialize components
    localStorage := storage.NewLocalStore(cfg.StoragePath)
    deviceManager := devices.NewManager(localStorage)
    mqttPublisher := mqtt.NewPublisher(cfg.AWS)
    eventProcessor := events.NewProcessor(deviceManager, mqttPublisher, localStorage)
    apiServer := api.NewServer(cfg.API, eventProcessor, deviceManager)
We’re building our system from the ground up. Local storage comes first—it’s the foundation everything else might fall back on if the network fails. The device manager tracks the state of every cage. The MQTT publisher handles cloud communication. The event processor is the brain that decides what to do with incoming data. And the API server lets cages talk to us.
Starting Services with Graceful Shutdown
    // Create context for graceful shutdown
    ctx, cancel := context.WithCancel(context.Background())
    defer cancel()

    // Start MQTT connection
    if err := mqttPublisher.Connect(ctx); err != nil {
        log.Fatalf("Failed to connect to AWS IoT: %v", err)
    }

    // Start event processor
    go eventProcessor.Run(ctx)

    // Start API server
    go func() {
        if err := apiServer.Start(); err != nil {
            log.Printf("API server error: %v", err)
        }
    }()

    log.Println("Smart Cage Gateway started successfully")
The context is Go’s way of managing cancellation—when we need to shut down, we
call cancel() and everything listening to that context knows to stop
gracefully. We start services with go routines—lightweight threads that run
concurrently. The MQTT connection blocks until established (we can’t do anything
without cloud connectivity), but the event processor and API server run in the
background.
Waiting for Shutdown Signals
    // Wait for shutdown signal
    sigChan := make(chan os.Signal, 1)
    signal.Notify(sigChan, syscall.SIGINT, syscall.SIGTERM)
    <-sigChan

    log.Println("Shutting down gateway...")
    cancel()
    mqttPublisher.Disconnect()
    apiServer.Stop()
    log.Println("Gateway stopped")
}
This is the Unix way of handling termination: catch SIGINT (Ctrl+C) and SIGTERM (systemd asking us to stop), then shut down cleanly. We cancel the context (which tells all our goroutines to wrap up), explicitly disconnect MQTT and stop the API server, then exit. No orphaned connections, no corrupted writes, no drama.
Networking Configuration
Setting up networking in a warehouse is an exercise in pessimism. You assume everything will fail, then design around it.
The Pi runs as a WiFi access point, creating a dedicated network just for the cages. This might seem like extra complexity—why not just use the existing warehouse wifi?—but it’s actually a simplification. We control the network entirely. No IT department involvement, no IP address conflicts, no “someone unplugged the router” surprises.
WiFi Access Point Setup
Installing the Foundation
First, we need the right tools on the Pi:
#!/bin/bash
# setup_ap.sh - Configure Raspberry Pi as WiFi Access Point

# Install required packages
sudo apt update
sudo apt install -y hostapd dnsmasq

# Stop services during configuration
sudo systemctl stop hostapd
sudo systemctl stop dnsmasq
hostapd turns the Pi into an access point—think of it as software that makes
the WiFi chip act like a router. dnsmasq is our DHCP and DNS server—it hands
out IP addresses to connecting cages and resolves names like
gateway.smartcage.local.
Configuring a Static IP
The gateway needs a predictable address. Can’t have it changing every reboot:
# /etc/dhcpcd.conf
interface wlan0
    static ip_address=192.168.4.1/24
    nohook wpa_supplicant
We’re claiming 192.168.4.1 as our address, with a /24 subnet (meaning
everything from 192.168.4.0 to 192.168.4.255 is in our network). The
nohook wpa_supplicant line tells the Pi “don’t try to connect to other WiFi
networks on this interface—we’re running the show here.”
Setting Up the DHCP Server
Now we configure dnsmasq to hand out addresses to cages:
# /etc/dnsmasq.conf
interface=wlan0
dhcp-range=192.168.4.2,192.168.4.100,255.255.255.0,24h
domain=smartcage.local
address=/gateway.smartcage.local/192.168.4.1
We’re giving out addresses from .2 to .100—that’s 99 possible cages on one
gateway. The lease time is 24 hours (cages won’t be moving around, so we don’t
need short leases). And we’re setting up local DNS so cages can reach us via
name instead of remembering an IP.
Configuring the Access Point
Here’s where we define what cages will see when they scan for WiFi:
# /etc/hostapd/hostapd.conf
interface=wlan0
driver=nl80211
ssid=SmartCage-Gateway
hw_mode=g
channel=7
wmm_enabled=0
macaddr_acl=0
auth_algs=1
ignore_broadcast_ssid=0
wpa=2
wpa_passphrase=SecureP@ss2024!
wpa_key_mgmt=WPA-PSK
wpa_pairwise=TKIP
rsn_pairwise=CCMP
Breaking this down: we’re using the 2.4GHz band (hw_mode=g) on channel 7, with
WPA2 encryption. The SSID is broadcast (not hidden), and the password is
SecureP@ss2024!. In production, you’d change this per facility. Channel 7 is
middle-of-the-road—less crowded than 1, 6, or 11, but still reliable.
Making It Permanent
Finally, we wire everything up to start automatically:
# Point hostapd to config
sudo sed -i 's/#DAEMON_CONF=""/DAEMON_CONF="\/etc\/hostapd\/hostapd.conf"/' /etc/default/hostapd

# Enable IP forwarding
sudo sed -i 's/#net.ipv4.ip_forward=1/net.ipv4.ip_forward=1/' /etc/sysctl.conf

# Enable and start services
sudo systemctl unmask hostapd
sudo systemctl enable hostapd
sudo systemctl enable dnsmasq
sudo systemctl start hostapd
sudo systemctl start dnsmasq
The unmask is necessary because hostapd comes masked by default on Raspberry
Pi OS (legacy reasons). The enable commands make sure these services start on
boot. And start fires them up right now.
Internet Connectivity
The Pi broadcasts a network, cages connect to it, they get IP addresses automatically, and they can reach the gateway at a fixed address (192.168.4.1). No DNS lookups, no DHCP surprises, no external dependencies.
For internet connectivity, the Pi uses its ethernet port—a wired connection to the warehouse’s main network. This separation is intentional. The cage network is air-gapped from the corporate network, which makes security audits much simpler. A compromised ESP32 can’t reach anything except the gateway.
Configuring the Uplink
The Pi needs to reach the internet to talk to AWS. That happens over Ethernet:
# /etc/network/interfaces.d/eth0
auto eth0
iface eth0 inet dhcp
Simple: connect Ethernet cable, get an IP via DHCP from the warehouse network. Done.
Setting Up NAT
Now the tricky part: cages talk to the Pi on wlan0, but the Pi talks to the
internet on eth0. We need Network Address Translation to bridge these:
# NAT configuration for cage devices to access internet if needed
sudo iptables -t nat -A POSTROUTING -o eth0 -j MASQUERADE
sudo iptables -A FORWARD -i eth0 -o wlan0 -m state --state RELATED,ESTABLISHED -j ACCEPT
sudo iptables -A FORWARD -i wlan0 -o eth0 -j ACCEPT
The first rule says “traffic leaving on eth0 should be masqueraded”—rewritten
to look like it’s coming from the Pi’s eth0 IP. The second allows return
traffic back through. The third allows cages to initiate connections outward.
Together, these make the Pi act like a router.
Persisting the Rules
iptables rules disappear on reboot unless you save them:
# Save iptables rules
sudo sh -c "iptables-save > /etc/iptables.ipv4.nat"

# Add to /etc/rc.local before 'exit 0'
iptables-restore < /etc/iptables.ipv4.nat
We dump the rules to a file, then tell the system to reload them on boot via
rc.local—an old-school but reliable way to run commands at startup.
Boot Configuration & System Setup
Industrial systems need to survive power outages. When electricity comes back after a blackout, every component must start itself, reconnect, and resume operation without human intervention. This is non-negotiable.
On the Pi, we achieve this with systemd—the Linux service manager that handles starting programs at boot and restarting them if they crash.
Systemd Service
This is how we tell Linux “keep this program running forever”:
# /etc/systemd/system/smartcage-gateway.service
[Unit]
Description=Smart Cage IoT Gateway
After=network-online.target
Wants=network-online.target
StartLimitIntervalSec=0
The [Unit] section describes what we are. The After and Wants lines say
“don’t start until the network is up”—there’s no point starting a
cloud-connected service without connectivity. StartLimitIntervalSec=0 means
“no limit on restart attempts”—keep trying forever.
Service Configuration
[Service]
Type=simple
Restart=always
RestartSec=5
User=pi
WorkingDirectory=/home/pi/smartcage-gateway
ExecStart=/home/pi/smartcage-gateway/bin/gateway
Environment=GATEWAY_CONFIG=/home/pi/smartcage-gateway/configs/config.yaml
Type=simple means the process doesn’t fork or daemonize—it just runs.
Restart=always is the magic: crash, get killed, encounter an error? Systemd
restarts it. RestartSec=5 means wait 5 seconds between attempts (prevents
restart loops from thrashing the system). We run as user pi for security—no
need for root privileges.
Resource Limits
# Resource limits
MemoryMax=256M
CPUQuota=80%
These prevent a runaway gateway from taking down the entire Pi. Cap it at 256MB of RAM (plenty for Go) and 80% of one CPU core (leaving room for the OS). Good defensive programming.
Logging Setup
# Logging
StandardOutput=append:/var/log/smartcage/gateway.log
StandardError=append:/var/log/smartcage/gateway-error.log

[Install]
WantedBy=multi-user.target
All stdout goes to one log, stderr to another. The append means we don’t
truncate on restart—logs accumulate. The [Install] section with
WantedBy=multi-user.target means “start this at normal system boot, when we
reach multi-user mode.”
The key line is Restart=always. If the gateway crashes—bug, memory issue,
cosmic ray, whatever—systemd will restart it within five seconds. Combined with
our stateless design (all important data is either in the cloud or persisted to
disk), this means the system self-heals from almost any failure.
The cages are simpler. An ESP32 boots in about two seconds. The firmware immediately tries to connect to the gateway network, and if it can’t, it keeps trying forever. There’s no complex recovery logic because there’s no complex state. Sensor triggered? Send event. No connection? Buffer locally, retry later. Power cycle? Start fresh, no harm done.
Configuration File
Gateway Configuration
The YAML configuration file defines all the operational parameters:
# /home/pi/smartcage-gateway/configs/config.yaml
gateway:
  id: "GW-WH001-01"
  facility_id: "WH001"
  log_level: "info"

api:
  host: "0.0.0.0"
  port: 8080
  read_timeout: 30s
  write_timeout: 30s
0.0.0.0 means “listen on all interfaces”—both the cage network and the
Ethernet connection. The 30-second timeouts are generous but necessary—image
uploads from cages can take time on a busy network.
Storage Configuration
storage:
  path: "/home/pi/smartcage-gateway/data"
  max_size_mb: 500
  retention_days: 7
We’ll buffer up to 500MB locally—enough for thousands of events. After 7 days or when we hit the size limit, old data gets purged. This is purely a buffer for when cloud connectivity fails; we’re not trying to be a permanent database.
AWS IoT Configuration
aws:
  region: "ap-south-1"
  iot_endpoint: "xxxxxxxxxxxxxx-ats.iot.ap-south-1.amazonaws.com"
  client_id: "smartcage-gateway-wh001"
  topic_prefix: "smartcage"
  cert_path: "/home/pi/smartcage-gateway/certs/gateway.cert.pem"
  key_path: "/home/pi/smartcage-gateway/certs/gateway.private.key"
  root_ca_path: "/home/pi/smartcage-gateway/certs/root-CA.crt"
  qos: 1
The IoT endpoint is specific to your AWS account. QoS 1 means “at least once delivery”—messages might duplicate, but they won’t be lost. The certificates are how we authenticate to AWS—no API keys, no passwords, just cryptographic identity.
Event Processing Configuration
events:
  batch_size: 10
  batch_timeout: 5s
  retry_attempts: 3
  retry_delay: 2s

devices:
  heartbeat_timeout: 600s
  bait_refresh_interval: 168h # 7 days
We batch up to 10 events before sending, or send whatever we have after 5 seconds—whichever comes first. Three retry attempts with 2-second delays handle transient network hiccups. If we don’t hear from a cage in 10 minutes, we consider it offline. And bait expires after 7 days (168 hours).
Initialization Script
#!/bin/bash
# /home/pi/smartcage-gateway/scripts/init.sh

set -e

GATEWAY_HOME="/home/pi/smartcage-gateway"
LOG_DIR="/var/log/smartcage"
DATA_DIR="${GATEWAY_HOME}/data"

# Create directories
sudo mkdir -p ${LOG_DIR}
sudo chown pi:pi ${LOG_DIR}
mkdir -p ${DATA_DIR}

# Set permissions on certificates
chmod 600 ${GATEWAY_HOME}/certs/*.key
chmod 644 ${GATEWAY_HOME}/certs/*.pem
chmod 644 ${GATEWAY_HOME}/certs/*.crt

# Install service
sudo cp ${GATEWAY_HOME}/scripts/smartcage-gateway.service /etc/systemd/system/
sudo systemctl daemon-reload
sudo systemctl enable smartcage-gateway
sudo systemctl start smartcage-gateway

echo "Smart Cage Gateway initialized successfully"
Device Signal Processing
All that the device can do is publish events. They have no meaning unless they are identified, interpreted and processed properly.
API Server for Receiving Device Events
Each cage communicates with the gateway over plain HTTP—RESTful endpoints accepting JSON payloads. We considered MQTT (the protocol du jour for IoT) but rejected it for simplicity. HTTP works fine for our message rates, every developer knows how to debug it, and the ESP32 has excellent HTTP client libraries.
The message format is deliberately flat and explicit. No nested objects, no arrays, no optional fields that might or might not appear. Every message contains everything we need to process it in isolation. This makes debugging trivial—you can literally read the JSON and understand what happened—and processing stateless on the server side.
Server Structure
The API server is where cages post their events:
// internal/api/server.go
package api

import (
    "context"
    "encoding/json"
    "fmt"
    "log"
    "net/http"
    "time"

    "smartcage-gateway/internal/devices"
    "smartcage-gateway/internal/events"
)

type Server struct {
    config         Config
    httpServer     *http.Server
    eventProcessor *events.Processor
    deviceManager  *devices.Manager
}

type Config struct {
    Host         string        `yaml:"host"`
    Port         int           `yaml:"port"`
    ReadTimeout  time.Duration `yaml:"read_timeout"`
    WriteTimeout time.Duration `yaml:"write_timeout"`
}
The Server struct holds everything we need: configuration, the actual HTTP
server, and references to our event processor and device manager. Keeping these
as fields means we don’t need global variables—better for testing and cleaner
code.
Initializing the Server
func NewServer(cfg Config, ep *events.Processor, dm *devices.Manager) *Server {
    s := &Server{
        config:         cfg,
        eventProcessor: ep,
        deviceManager:  dm,
    }

    mux := http.NewServeMux()
    mux.HandleFunc("/api/events", s.handleEvent)
    mux.HandleFunc("/api/devices", s.handleDevices)
    mux.HandleFunc("/api/devices/", s.handleDeviceAction)
    mux.HandleFunc("/health", s.handleHealth)

    s.httpServer = &http.Server{
        Addr:         fmt.Sprintf("%s:%d", cfg.Host, cfg.Port),
        Handler:      mux,
        ReadTimeout:  cfg.ReadTimeout,
        WriteTimeout: cfg.WriteTimeout,
    }

    return s
}
We’re setting up a standard HTTP multiplexer with four endpoints: /api/events
for incoming cage data, /api/devices for listing all devices, /api/devices/
for device-specific actions, and /health for monitoring. The timeout
configuration prevents slow clients from tying up server resources.
Handling Incoming Events
This is the hot path—where every cage event lands:
func (s *Server) handleEvent(w http.ResponseWriter, r *http.Request) {
    if r.Method != http.MethodPost {
        http.Error(w, "Method not allowed", http.StatusMethodNotAllowed)
        return
    }

    var evt events.DeviceEvent
    if err := json.NewDecoder(r.Body).Decode(&evt); err != nil {
        log.Printf("Failed to decode event: %v", err)
        http.Error(w, "Invalid JSON payload", http.StatusBadRequest)
        return
    }

    // Set server-side timestamp
    evt.ReceivedAt = time.Now().UTC()
We only accept POST requests (GETs don’t make sense for submitting data). We decode the JSON directly from the request body—no need to read it all into memory first. And we add a server-side timestamp—never fully trust client clocks, especially on devices that might have been powered off for days.
Validation and Processing
    // Validate required fields
    if evt.DeviceID == "" || evt.EventType == "" {
        http.Error(w, "Missing required fields", http.StatusBadRequest)
        return
    }

    // Process the event
    if err := s.eventProcessor.Submit(evt); err != nil {
        log.Printf("Failed to process event from %s: %v", evt.DeviceID, err)
        http.Error(w, "Internal server error", http.StatusInternalServerError)
        return
    }

    // Update device state
    s.deviceManager.UpdateDevice(evt)

    w.WriteHeader(http.StatusOK)
    json.NewEncoder(w).Encode(map[string]string{
        "status": "accepted",
        "event_id": evt.EventID,
    })
}
Basic validation: device ID and event type are mandatory. Submit to the event processor (which might batch it, analyze it, whatever). Update the device manager’s view of this cage’s state. Send back a 200 OK with the event ID so the cage knows we got it. Fast, simple, reliable.
Device Listing Endpoint
func (s *Server) handleDevices(w http.ResponseWriter, r *http.Request) {
    if r.Method != http.MethodGet {
        http.Error(w, "Method not allowed", http.StatusMethodNotAllowed)
        return
    }

    devices := s.deviceManager.GetAllDevices()
    json.NewEncoder(w).Encode(devices)
}
This one’s simple: when asked, dump out the current state of all known devices. Useful for debugging and for dashboards that want a snapshot.
Device Actions Endpoint
func (s *Server) handleDeviceAction(w http.ResponseWriter, r *http.Request) {
    // Handle device-specific actions like bait refresh acknowledgment
    deviceID := r.URL.Path[len("/api/devices/"):]

    switch r.Method {
    case http.MethodPost:
        var action struct {
            Action string `json:"action"`
        }
        if err := json.NewDecoder(r.Body).Decode(&action); err != nil {
            http.Error(w, "Invalid request", http.StatusBadRequest)
            return
        }

        switch action.Action {
        case "refresh_bait":
            s.deviceManager.RecordBaitRefresh(deviceID)
            w.WriteHeader(http.StatusOK)
        case "reset_trap":
            s.deviceManager.ResetTrap(deviceID)
            w.WriteHeader(http.StatusOK)
        default:
            http.Error(w, "Unknown action", http.StatusBadRequest)
        }
    default:
        http.Error(w, "Method not allowed", http.StatusMethodNotAllowed)
    }
}
This handles commands to devices. When maintenance staff refreshes bait or resets a trap, the dashboard POSTs here. We parse out the device ID from the URL path and dispatch to the appropriate action. In a more sophisticated system, these actions would queue actual commands to send back to the ESP32s.
Health Check
func (s *Server) handleHealth(w http.ResponseWriter, r *http.Request) {
    json.NewEncoder(w).Encode(map[string]interface{}{
        "status":    "healthy",
        "timestamp": time.Now().UTC(),
        "devices":   s.deviceManager.GetDeviceCount(),
    })
}
Monitoring systems love health checks. Returns 200 OK if we’re running, along with some basic stats. If this endpoint stops responding, something’s very wrong.
Server Lifecycle
func (s *Server) Start() error {
    log.Printf("Starting API server on %s", s.httpServer.Addr)
    return s.httpServer.ListenAndServe()
}

func (s *Server) Stop() error {
    ctx, cancel := context.WithTimeout(context.Background(), 10*time.Second)
    defer cancel()
    return s.httpServer.Shutdown(ctx)
}
Start() blocks until the server stops (which only happens on error or
shutdown). Stop() does a graceful shutdown: stop accepting new connections,
finish processing active requests, but give up after 10 seconds if something’s
hung.
Data Collation & Event Detection
An important step in data processing is collating the data to make sense out of it.
Event Types and Processing Logic
Defining Our Event Universe
First, we enumerate everything that can happen:
// internal/events/types.go
package events

import "time"

type EventType string

const (
    EventTrapTriggered EventType = "TRAP_TRIGGERED"
    EventMotionDetected EventType = "MOTION_DETECTED"
    EventHeartbeat      EventType = "HEARTBEAT"
    EventBaitRefreshed  EventType = "BAIT_REFRESHED"
    EventLowBattery     EventType = "LOW_BATTERY"
    EventDeviceOffline  EventType = "DEVICE_OFFLINE"
    EventBaitExpired    EventType = "BAIT_EXPIRED"
)
Using constants instead of bare strings prevents typos and makes refactoring easier. The type system enforces correctness—you can’t accidentally pass “TRAP_TRIGGERD” (with a typo).
The Device Event Structure
type DeviceEvent struct {
    EventID     string    `json:"event_id"`
    DeviceID    string    `json:"device_id"`
    FacilityID  string    `json:"facility_id"`
    Zone        string    `json:"zone"`
    EventType   EventType `json:"event_type"`
    Timestamp   int64     `json:"timestamp"`
    ReceivedAt  time.Time `json:"received_at"`

    // Optional fields based on event type
    BatteryLevel  float64 `json:"battery_level,omitempty"`
    TrapStatus    string  `json:"trap_status,omitempty"`
    MotionCount   int     `json:"motion_count,omitempty"`
    WifiRSSI      int     `json:"wifi_rssi,omitempty"`
    ImageData     string  `json:"image_data,omitempty"`
    LastBaitRefresh int64 `json:"last_bait_refresh,omitempty"`
}
The omitempty tags mean these fields disappear from JSON if they’re
zero/empty. A heartbeat doesn’t need ImageData, so why waste bytes
transmitting an empty string? This makes our payloads leaner.
The Cloud Event Wrapper
type CloudEvent struct {
    GatewayID  string       `json:"gateway_id"`
    FacilityID string       `json:"facility_id"`
    Timestamp  time.Time    `json:"timestamp"`
    Events     []DeviceEvent `json:"events"`
}
When we send data to AWS, we batch multiple device events into a single cloud event. This is more efficient—one MQTT message can carry 10 cage events, reducing overhead.
Priority System
// Priority levels for event processing
type Priority int

const (
    PriorityLow    Priority = 0
    PriorityNormal Priority = 1
    PriorityHigh   Priority = 2
    PriorityCritical Priority = 3
)

func (e DeviceEvent) GetPriority() Priority {
    switch e.EventType {
    case EventTrapTriggered:
        return PriorityCritical
    case EventLowBattery, EventDeviceOffline, EventBaitExpired:
        return PriorityHigh
    case EventMotionDetected:
        return PriorityNormal
    default:
        return PriorityLow
    }
}
Not all events are equally urgent. A trap trigger demands immediate attention—someone needs to go collect that rat. Low battery is important but not instant. Motion detection is just informational. The priority system lets us bypass batching for critical events—they go to the cloud immediately.
Event Processor
Processor Structure
The event processor is the engine that makes decisions about incoming data:
// internal/events/processor.go
package events

import (
    "context"
    "log"
    "sync"
    "time"

    "github.com/google/uuid"

    "smartcage-gateway/internal/devices"
    "smartcage-gateway/internal/mqtt"
    "smartcage-gateway/internal/storage"
)

type Processor struct {
    deviceManager *devices.Manager
    publisher     *mqtt.Publisher
    localStorage  *storage.LocalStore

    eventChan     chan DeviceEvent
    batchSize     int
    batchTimeout  time.Duration

    // Derived event detection
    mu            sync.Mutex
    motionWindows map[string]*MotionWindow
}

type MotionWindow struct {
    DeviceID    string
    Count       int
    FirstSeen   time.Time
    LastSeen    time.Time
}
The eventChan is a buffered channel—events queue up here waiting to be
processed. The motionWindows map tracks activity patterns per device, letting
us detect unusual clustering. The sync.Mutex protects that map from concurrent
access—multiple goroutines will be touching it.
Creating a Processor
type ProcessorConfig struct {
    BatchSize     int           `yaml:"batch_size"`
    BatchTimeout  time.Duration `yaml:"batch_timeout"`
    RetryAttempts int           `yaml:"retry_attempts"`
    RetryDelay    time.Duration `yaml:"retry_delay"`
}

func NewProcessor(dm *devices.Manager, pub *mqtt.Publisher, ls *storage.LocalStore) *Processor {
    return &Processor{
        deviceManager: dm,
        publisher:     pub,
        localStorage:  ls,
        eventChan:     make(chan DeviceEvent, 1000),
        batchSize:     10,
        batchTimeout:  5 * time.Second,
        motionWindows: make(map[string]*MotionWindow),
    }
}
The channel buffer of 1000 means we can queue that many events before blocking. In practice, we process faster than cages generate events, but the buffer handles burst traffic—like when the gateway boots up and 50 cages send heartbeats simultaneously.
Submitting Events for Processing
func (p *Processor) Submit(evt DeviceEvent) error {
    // Generate event ID if not present
    if evt.EventID == "" {
        evt.EventID = uuid.New().String()
    }

    // Enrich event with derived data
    p.enrichEvent(&evt)

    // Check for derived events
    derivedEvents := p.detectDerivedEvents(evt)
Before queueing an event, we do some preprocessing. Generate a unique ID if the cage didn’t provide one (defensive programming). Enrich it with server-side analysis. And see if this event should trigger synthetic events—like detecting that bait has expired based on the timestamp in a heartbeat.
Queueing Events
    // Submit original event
    select {
    case p.eventChan <- evt:
    default:
        // Channel full - store locally for retry
        p.localStorage.StoreEvent(evt)
        log.Printf("Event channel full, stored locally: %s", evt.EventID)
    }

    // Submit any derived events
    for _, de := range derivedEvents {
        p.eventChan <- de
    }

    return nil
}
The select with a default case is non-blocking: try to send to the channel,
but if it’s full, don’t wait—store locally instead. This prevents cage requests
from hanging if we’re overwhelmed. Derived events go straight to the channel—we
generated them, they’re not coming from cages, so they’re trusted.
Event Enrichment
func (p *Processor) enrichEvent(evt *DeviceEvent) {
    // Add gateway timestamp
    evt.ReceivedAt = time.Now().UTC()

    // Check battery level and generate alert if low
    if evt.BatteryLevel > 0 && evt.BatteryLevel < 20 {
        log.Printf("Low battery alert for device %s: %.1f%%",
                   evt.DeviceID, evt.BatteryLevel)
    }
}
Simple but important: add our timestamp, check for low battery. In a production system, you might add more analysis here—signal quality trends, unusual timing patterns, whatever makes sense for your domain.
Detecting Derived Events
This is where we get smart—spotting problems the cages don’t explicitly report:
func (p *Processor) detectDerivedEvents(evt DeviceEvent) []DeviceEvent {
    var derived []DeviceEvent

    // Detect bait expiration
    if evt.EventType == EventHeartbeat && evt.LastBaitRefresh > 0 {
        baitAge := time.Since(time.Unix(evt.LastBaitRefresh/1000, 0))
        if baitAge > 7*24*time.Hour { // 7 days
            derived = append(derived, DeviceEvent{
                EventID:    uuid.New().String(),
                DeviceID:   evt.DeviceID,
                FacilityID: evt.FacilityID,
                Zone:       evt.Zone,
                EventType:  EventBaitExpired,
                Timestamp:  time.Now().UnixMilli(),
                ReceivedAt: time.Now().UTC(),
            })
        }
    }
A heartbeat carries the last bait refresh timestamp. If that’s more than 7 days
ago, we synthesize a BaitExpired event. The cage doesn’t need to know about
this rule—we centralize the logic on the gateway where it’s easier to update.
Detecting Activity Patterns
    // Detect unusual motion patterns
    if evt.EventType == EventMotionDetected {
        p.mu.Lock()
        window, exists := p.motionWindows[evt.DeviceID]
        if !exists {
            window = &MotionWindow{
                DeviceID:  evt.DeviceID,
                FirstSeen: time.Now(),
            }
            p.motionWindows[evt.DeviceID] = window
        }

        window.Count++
        window.LastSeen = time.Now()

        // Alert if high motion in short window (potential infestation hotspot)
        if window.Count > 50 && time.Since(window.FirstSeen) < time.Hour {
            log.Printf("High activity detected at %s: %d events in %v",
                       evt.DeviceID, window.Count, time.Since(window.FirstSeen))
        }

        // Reset window after 1 hour
        if time.Since(window.FirstSeen) > time.Hour {
            window.Count = 1
            window.FirstSeen = time.Now()
        }
        p.mu.Unlock()
    }

    return derived
}
We track motion events over a sliding 1-hour window. If we see more than 50 events in an hour at one location, that’s unusual—log it, potentially alert facilities management. This kind of pattern detection is why we process at the edge rather than sending everything raw to the cloud.
The Main Event Processing Loop
This goroutine runs continuously, consuming events from the channel:
func (p *Processor) Run(ctx context.Context) {
    ticker := time.NewTicker(p.batchTimeout)
    defer ticker.Stop()

    var batch []DeviceEvent

    for {
        select {
        case <-ctx.Done():
            // Flush remaining events
            if len(batch) > 0 {
                p.publishBatch(batch)
            }
            return
The ctx.Done() channel closes when the gateway is shutting down. We flush any
pending events before exiting—don’t lose data just because we’re stopping.
Receiving Events
        case evt := <-p.eventChan:
            batch = append(batch, evt)

            // Publish immediately for critical events
            if evt.GetPriority() == PriorityCritical {
                p.publishBatch(batch)
                batch = nil
                continue
            }

            // Publish when batch is full
            if len(batch) >= p.batchSize {
                p.publishBatch(batch)
                batch = nil
            }
Critical events bypass batching—they go out immediately. For everything else, we
accumulate until we hit batchSize (10 events), then send them all at once.
This is the efficiency trade-off: lower latency for urgent events, higher
throughput for routine ones.
Timeout-Based Publishing
        case <-ticker.C:
            // Publish on timeout even if batch not full
            if len(batch) > 0 {
                p.publishBatch(batch)
                batch = nil
            }

            // Also retry any locally stored events
            p.retryStoredEvents()
        }
    }
}
The ticker fires every 5 seconds. If we have any events (even just one), send them—don’t let them sit forever waiting for a full batch. And use this opportunity to retry any events we had to store locally due to connectivity issues.
Publishing a Batch
func (p *Processor) publishBatch(events []DeviceEvent) {
    if len(events) == 0 {
        return
    }

    cloudEvent := CloudEvent{
        GatewayID:  "GW-WH001-01", // From config
        FacilityID: events[0].FacilityID,
        Timestamp:  time.Now().UTC(),
        Events:     events,
    }

    if err := p.publisher.Publish(cloudEvent); err != nil {
        log.Printf("Failed to publish batch: %v", err)
        // Store locally for retry
        for _, evt := range events {
            p.localStorage.StoreEvent(evt)
        }
    } else {
        log.Printf("Published batch of %d events", len(events))
    }
}
Wrap the events in a CloudEvent envelope, try to publish. If it fails (network
down, AWS unreachable, whatever), don’t lose the data—store locally. When
connectivity returns, retryStoredEvents() will pick them up.
Retrying Failed Events
func (p *Processor) retryStoredEvents() {
    events := p.localStorage.GetPendingEvents(p.batchSize)
    if len(events) == 0 {
        return
    }

    log.Printf("Retrying %d stored events", len(events))
    p.publishBatch(events)
}
Pull a batch of stored events, try publishing again. If it succeeds, great—they’re on their way to the cloud. If it fails, they get stored again. Eventually connectivity returns and everything drains.
Cloud Publishing with AWS IoT Core
The gateway talks to AWS using MQTT—a lightweight pub/sub protocol designed for unreliable networks and constrained devices. Think of it as the postal service for IoT: you hand messages to a broker, and it makes sure they reach their destination.
MQTT Publisher
Publisher Structure and Configuration
First, let’s look at how we organize the MQTT client:
// internal/mqtt/publisher.go
package mqtt

import (
    "context"
    "crypto/tls"
    "crypto/x509"
    "encoding/json"
    "fmt"
    "log"
    "os"
    "sync"
    "time"

    MQTT "github.com/eclipse/paho.mqtt.golang"

    "smartcage-gateway/internal/events"
)

type Publisher struct {
    config   AWSConfig
    client   MQTT.Client
    mu       sync.Mutex
    connected bool
}

type AWSConfig struct {
    Region      string `yaml:"region"`
    IoTEndpoint string `yaml:"iot_endpoint"`
    ClientID    string `yaml:"client_id"`
    TopicPrefix string `yaml:"topic_prefix"`
    CertPath    string `yaml:"cert_path"`
    KeyPath     string `yaml:"key_path"`
    RootCAPath  string `yaml:"root_ca_path"`
    QoS         int    `yaml:"qos"`
}
The Publisher wraps the MQTT client and adds thread-safe connection tracking.
The mutex protects the connected boolean—multiple goroutines will be checking
this, and Go requires explicit synchronization for shared state.
Creating a Publisher Instance
func NewPublisher(cfg AWSConfig) *Publisher {
    return &Publisher{
        config: cfg,
    }
}
Simple constructor. We don’t connect yet—that happens explicitly in Connect().
This separation of creation and connection is important for testing and
initialization ordering.
Establishing the Connection
The connection setup is where the security happens:
func (p *Publisher) Connect(ctx context.Context) error {
    tlsConfig, err := p.newTLSConfig()
    if err != nil {
        return fmt.Errorf("failed to create TLS config: %w", err)
    }

    opts := MQTT.NewClientOptions()
    opts.AddBroker(fmt.Sprintf("ssl://%s:8883", p.config.IoTEndpoint))
    opts.SetClientID(p.config.ClientID)
    opts.SetTLSConfig(tlsConfig)
    opts.SetKeepAlive(30 * time.Second)
    opts.SetAutoReconnect(true)
    opts.SetMaxReconnectInterval(5 * time.Minute)
We’re connecting over SSL/TLS on port 8883 (the secure MQTT port). The
SetClientID uniquely identifies this gateway to AWS. The 30-second keepalive
means “send a ping every 30 seconds to prove we’re alive.” Auto-reconnect with
exponential backoff (capping at 5 minutes) handles network hiccups gracefully.
Connection Event Handlers
These callbacks tell us what’s happening with the connection:
    opts.SetOnConnectHandler(func(c MQTT.Client) {
        log.Println("Connected to AWS IoT Core")
        p.mu.Lock()
        p.connected = true
        p.mu.Unlock()
    })

    opts.SetConnectionLostHandler(func(c MQTT.Client, err error) {
        log.Printf("Connection lost: %v", err)
        p.mu.Lock()
        p.connected = false
        p.mu.Unlock()
    })
When we successfully connect, set the flag and log it. When we lose connection, clear the flag and log why. These callbacks run in the MQTT library’s goroutines, so we use the mutex to safely update our state.
Starting the Client
    p.client = MQTT.NewClient(opts)

    token := p.client.Connect()
    if token.Wait() && token.Error() != nil {
        return fmt.Errorf("failed to connect: %w", token.Error())
    }

    return nil
}
The Paho MQTT library is asynchronous—Connect() returns a token immediately,
and you wait on the token for completion. If the token returns an error,
connection failed. Otherwise, we’re live.
TLS Configuration: The Security Layer
This is where we load our certificates and configure encryption:
func (p *Publisher) newTLSConfig() (*tls.Config, error) {
    certPool := x509.NewCertPool()
    ca, err := os.ReadFile(p.config.RootCAPath)
    if err != nil {
        return nil, fmt.Errorf("failed to read root CA: %w", err)
    }
    certPool.AppendCertsFromPEM(ca)
First, we load the root CA certificate—this is how we verify we’re actually talking to AWS and not some imposter. The CA cert is the trust anchor of the entire security chain.
Loading Client Certificates
    cert, err := tls.LoadX509KeyPair(p.config.CertPath, p.config.KeyPath)
    if err != nil {
        return nil, fmt.Errorf("failed to load cert/key: %w", err)
    }

    return &tls.Config{
        RootCAs:      certPool,
        Certificates: []tls.Certificate{cert},
        MinVersion:   tls.VersionTLS12,
    }, nil
}
The client certificate and private key are this gateway’s identity. AWS IoT validates the certificate against its registry and grants access based on attached policies. TLS 1.2 minimum ensures we’re using strong encryption—no obsolete protocols.
Publishing Events to AWS
This is the main method—getting our data to the cloud:
func (p *Publisher) Publish(event events.CloudEvent) error {
    p.mu.Lock()
    connected := p.connected
    p.mu.Unlock()

    if !connected {
        return fmt.Errorf("not connected to broker")
    }
Check connection status first. If we’re not connected, fail fast—don’t try to publish. The caller (event processor) will store locally and retry later.
Serializing and Routing
    payload, err := json.Marshal(event)
    if err != nil {
        return fmt.Errorf("failed to marshal event: %w", err)
    }

    // Determine topic based on event priority
    topic := p.determineTopic(event)

    token := p.client.Publish(topic, byte(p.config.QoS), false, payload)
    if token.Wait() && token.Error() != nil {
        return fmt.Errorf("failed to publish: %w", token.Error())
    }

    log.Printf("Published to %s: %d events", topic, len(event.Events))
    return nil
}
Convert the event to JSON, determine which topic to publish to (more on that in
a moment), then publish with our configured QoS. The false parameter means
“not retained”—this is ephemeral event data, not state that needs to persist.
Smart Topic Routing
Different event types go to different topics for efficient processing:
func (p *Publisher) determineTopic(event events.CloudEvent) string {
    // Route critical events to dedicated topic for faster processing
    for _, e := range event.Events {
        if e.GetPriority() == events.PriorityCritical {
            return fmt.Sprintf("%s/%s/alerts",
                             p.config.TopicPrefix, event.FacilityID)
        }
    }
    return fmt.Sprintf("%s/%s/events", p.config.TopicPrefix, event.FacilityID)
}
If the batch contains any critical events (trap triggered, device offline),
route to the alerts topic. Otherwise, use the general events topic. In AWS,
we can set up different Lambda functions subscribed to different topics—letting
us process critical alerts with higher priority and resources.
Disconnecting Cleanly
func (p *Publisher) Disconnect() {
    if p.client != nil && p.client.IsConnected() {
        p.client.Disconnect(1000)
        log.Println("Disconnected from AWS IoT Core")
    }
}

func (p *Publisher) IsConnected() bool {
    p.mu.Lock()
    defer p.mu.Unlock()
    return p.connected
}
The 1000 parameter to Disconnect() means “wait up to 1000 milliseconds for
in-flight messages to complete.” This ensures we don’t cut off a publish in
progress. The IsConnected() method safely checks status from any goroutine.
AWS Lambda Functions
Lambda functions are where our data lands in the cloud. They’re serverless—AWS runs them on demand, scales them automatically, and we only pay for actual execution time. Perfect for event-driven IoT workloads.
Event Ingestion Lambda
This Lambda receives MQTT messages from IoT Core and persists them to DynamoDB.
Imports and Initialization
// lambda/ingest/main.go
package main

import (
    "context"
    "encoding/json"
    "fmt"
    "log"
    "os"
    "time"

    "github.com/aws/aws-lambda-go/events"
    "github.com/aws/aws-lambda-go/lambda"
    "github.com/aws/aws-sdk-go-v2/config"
    "github.com/aws/aws-sdk-go-v2/service/dynamodb"
    "github.com/aws/aws-sdk-go-v2/service/dynamodb/types"
    "github.com/aws/aws-sdk-go-v2/feature/dynamodb/attributevalue"
)

var (
    ddbClient  *dynamodb.Client
    tableName  string
    alertTable string
)
Global variables in Lambda are initialized once per container and reused across invocations. This is a performance optimization—we don’t want to create a new DynamoDB client on every single event.
Defining Our Data Structures
type CloudEvent struct {
    GatewayID  string        `json:"gateway_id"`
    FacilityID string        `json:"facility_id"`
    Timestamp  time.Time     `json:"timestamp"`
    Events     []DeviceEvent `json:"events"`
}

type DeviceEvent struct {
    EventID       string  `json:"event_id"`
    DeviceID      string  `json:"device_id"`
    FacilityID    string  `json:"facility_id"`
    Zone          string  `json:"zone"`
    EventType     string  `json:"event_type"`
    Timestamp     int64   `json:"timestamp"`
    BatteryLevel  float64 `json:"battery_level,omitempty"`
    TrapStatus    string  `json:"trap_status,omitempty"`
    MotionCount   int     `json:"motion_count,omitempty"`
    WifiRSSI      int     `json:"wifi_rssi,omitempty"`
    ImageData     string  `json:"image_data,omitempty"`
}
These mirror the structures we defined on the gateway. Consistency across the stack makes debugging easier—the same JSON that leaves the Pi arrives here unchanged.
DynamoDB Record Structure
DynamoDB is a NoSQL database, but we still need a schema for our access patterns:
// DynamoDB record structure
type EventRecord struct {
    PK            string    `dynamodbav:"PK"`              // DEVICE#<device_id>
    SK            string    `dynamodbav:"SK"`              // EVENT#<timestamp>#<event_id>
    GSI1PK        string    `dynamodbav:"GSI1PK"`          // FACILITY#<facility_id>
    GSI1SK        string    `dynamodbav:"GSI1SK"`          // <event_type>#<timestamp>
    EventID       string    `dynamodbav:"event_id"`
    DeviceID      string    `dynamodbav:"device_id"`
    FacilityID    string    `dynamodbav:"facility_id"`
    Zone          string    `dynamodbav:"zone"`
    EventType     string    `dynamodbav:"event_type"`
    Timestamp     int64     `dynamodbav:"timestamp"`
    BatteryLevel  float64   `dynamodbav:"battery_level,omitempty"`
    TrapStatus    string    `dynamodbav:"trap_status,omitempty"`
    MotionCount   int       `dynamodbav:"motion_count,omitempty"`
    WifiRSSI      int       `dynamodbav:"wifi_rssi,omitempty"`
    ImageS3Key    string    `dynamodbav:"image_s3_key,omitempty"`
    TTL           int64     `dynamodbav:"ttl"`
    CreatedAt     string    `dynamodbav:"created_at"`
}
The PK (partition key) and SK (sort key) define how data is physically
stored. By using DEVICE#<id> as PK, all events for a device are co-located for
fast retrieval. The GSI1 keys enable querying by facility and event type—a
Global Secondary Index with a different key structure.
Lambda Initialization
func init() {
    cfg, err := config.LoadDefaultConfig(context.Background())
    if err != nil {
        log.Fatalf("Failed to load AWS config: %v", err)
    }

    ddbClient = dynamodb.NewFromConfig(cfg)
    tableName = os.Getenv("EVENTS_TABLE")
    alertTable = os.Getenv("ALERTS_TABLE")

    if tableName == "" {
        tableName = "smartcage-events"
    }
}
The init() function runs once when Lambda creates a new container. We load AWS
credentials (automatically provided by the Lambda execution role), create our
DynamoDB client, and read configuration from environment variables. If
EVENTS_TABLE isn’t set, we default to a sensible name.
The Handler Function
This is the entry point—invoked by AWS for each MQTT message:
func handler(ctx context.Context, iotEvent events.IoTCoreCustomAuthorizerRequest) error {
    // Parse the incoming IoT message
    var cloudEvent CloudEvent
    if err := json.Unmarshal([]byte(iotEvent.Token), &cloudEvent); err != nil {
        log.Printf("Failed to parse event: %v", err)
        return err
    }

    log.Printf("Processing %d events from gateway %s",
               len(cloudEvent.Events), cloudEvent.GatewayID)
AWS IoT Core triggers this Lambda by passing the MQTT message payload. We
unmarshal the JSON into our CloudEvent structure, log what we’re processing,
then iterate through the individual device events.
Processing Each Event
    // Process each event
    for _, evt := range cloudEvent.Events {
        if err := processEvent(ctx, evt); err != nil {
            log.Printf("Failed to process event %s: %v", evt.EventID, err)
            // Continue processing other events
        }
    }

    return nil
}
We process events individually rather than in a transaction because partial failure is acceptable here. If one event has malformed data, we don’t want that to block the other 9 in the batch. Log the error, move on.
Processing a Single Event
This is where we actually store data:
func processEvent(ctx context.Context, evt DeviceEvent) error {
    // Create DynamoDB record with proper key structure
    record := EventRecord{
        PK:           fmt.Sprintf("DEVICE#%s", evt.DeviceID),
        SK:           fmt.Sprintf("EVENT#%d#%s", evt.Timestamp, evt.EventID),
        GSI1PK:       fmt.Sprintf("FACILITY#%s", evt.FacilityID),
        GSI1SK:       fmt.Sprintf("%s#%d", evt.EventType, evt.Timestamp),
        EventID:      evt.EventID,
        DeviceID:     evt.DeviceID,
        FacilityID:   evt.FacilityID,
        Zone:         evt.Zone,
        EventType:    evt.EventType,
        Timestamp:    evt.Timestamp,
        BatteryLevel: evt.BatteryLevel,
        TrapStatus:   evt.TrapStatus,
        MotionCount:  evt.MotionCount,
        WifiRSSI:     evt.WifiRSSI,
        TTL:          time.Now().Add(90 * 24 * time.Hour).Unix(), // 90 days retention
        CreatedAt:    time.Now().UTC().Format(time.RFC3339),
    }
We construct composite keys that enable our access patterns. Want all events for
a device? Query on PK = "DEVICE#WH001-A-042". Want all trap triggers for a
facility today? Use the GSI with GSI1PK = "FACILITY#WH001" and GSI1SK
starting with "TRAP_TRIGGERED#". The TTL means DynamoDB will automatically
delete this record after 90 days—no manual cleanup needed.
Handling Images
    // Handle image data - store in S3 if present
    if evt.ImageData != "" {
        s3Key, err := storeImage(ctx, evt)
        if err != nil {
            log.Printf("Failed to store image: %v", err)
        } else {
            record.ImageS3Key = s3Key
        }
    }
Base64-encoded images in the JSON payload can be huge. We extract them and store in S3 (cheap blob storage), then just keep a reference (the S3 key) in DynamoDB. This keeps our database lean and fast.
Writing to DynamoDB
    // Marshal to DynamoDB attribute values
    av, err := attributevalue.MarshalMap(record)
    if err != nil {
        return fmt.Errorf("failed to marshal record: %w", err)
    }

    // Write to DynamoDB
    _, err = ddbClient.PutItem(ctx, &dynamodb.PutItemInput{
        TableName: &tableName,
        Item:      av,
    })
    if err != nil {
        return fmt.Errorf("failed to write to DynamoDB: %w", err)
    }
The attributevalue.MarshalMap converts our Go struct into DynamoDB’s native
format. PutItem is an upsert—if a record with these keys already exists, it’s
overwritten. In our case, event IDs are unique, so this is effectively an
insert.
Creating Alerts for Critical Events
    // Create alert for critical events
    if isCriticalEvent(evt.EventType) {
        if err := createAlert(ctx, evt); err != nil {
            log.Printf("Failed to create alert: %v", err)
        }
    }

    log.Printf("Processed event %s (%s) from device %s",
               evt.EventID, evt.EventType, evt.DeviceID)
    return nil
}
Trap triggers, low battery warnings, and device offline events get written to a separate alerts table. This makes it trivial for the dashboard to query “show me all unresolved alerts”—just scan the alerts table where status is “PENDING.”
Checking Event Criticality
func isCriticalEvent(eventType string) bool {
    criticalTypes := map[string]bool{
        "TRAP_TRIGGERED": true,
        "LOW_BATTERY":    true,
        "DEVICE_OFFLINE": true,
        "BAIT_EXPIRED":   true,
    }
    return criticalTypes[eventType]
}
A simple lookup. Using a map instead of a switch statement makes it easy to add new critical event types without changing function signatures.
Creating an Alert Record
func createAlert(ctx context.Context, evt DeviceEvent) error {
    alert := map[string]types.AttributeValue{
        "PK":          &types.AttributeValueMemberS{Value: fmt.Sprintf("FACILITY#%s", evt.FacilityID)},
        "SK":          &types.AttributeValueMemberS{Value: fmt.Sprintf("ALERT#%d#%s", evt.Timestamp, evt.EventID)},
        "device_id":   &types.AttributeValueMemberS{Value: evt.DeviceID},
        "event_type":  &types.AttributeValueMemberS{Value: evt.EventType},
        "zone":        &types.AttributeValueMemberS{Value: evt.Zone},
        "timestamp":   &types.AttributeValueMemberN{Value: fmt.Sprintf("%d", evt.Timestamp)},
        "status":      &types.AttributeValueMemberS{Value: "PENDING"},
        "created_at":  &types.AttributeValueMemberS{Value: time.Now().UTC().Format(time.RFC3339)},
    }

    _, err := ddbClient.PutItem(ctx, &dynamodb.PutItemInput{
        TableName: &alertTable,
        Item:      alert,
    })
    return err
}
We manually construct the attribute map here instead of using a struct—it’s a simple record and this is more direct. The status starts as “PENDING”; when someone acknowledges it, we’ll update it to “ACKNOWLEDGED” or “RESOLVED.”
Image Storage Stub
func storeImage(ctx context.Context, evt DeviceEvent) (string, error) {
    // Image storage implementation
    // Returns S3 key for the stored image
    return fmt.Sprintf("images/%s/%s/%s.jpg",
                       evt.FacilityID, evt.DeviceID, evt.EventID), nil
}
This is simplified for the article. In production, you’d decode the base64, upload to S3 using the AWS SDK, handle errors, maybe compress or resize the image, etc. But the pattern is simple: store in S3, return the key, save the key in the database.
Starting the Lambda
func main() {
    lambda.Start(handler)
}
This tells the AWS Lambda runtime “my handler function is called handler.”
When events arrive, call that function. Simple as that.
API Lambda for Dashboard
The dashboard needs to query data. This Lambda provides the REST API.
Lambda Initialization and Globals
// lambda/api/main.go
package main

import (
    "context"
    "encoding/json"
    "fmt"
    "log"
    "net/http"
    "os"
    "strconv"

    "github.com/aws/aws-lambda-go/events"
    "github.com/aws/aws-lambda-go/lambda"
    "github.com/aws/aws-sdk-go-v2/aws"
    "github.com/aws/aws-sdk-go-v2/config"
    "github.com/aws/aws-sdk-go-v2/service/dynamodb"
    "github.com/aws/aws-sdk-go-v2/feature/dynamodb/attributevalue"
)

var (
    ddbClient   *dynamodb.Client
    eventsTable string
    alertsTable string
)

func init() {
    cfg, _ := config.LoadDefaultConfig(context.Background())
    ddbClient = dynamodb.NewFromConfig(cfg)
    eventsTable = os.Getenv("EVENTS_TABLE")
    alertsTable = os.Getenv("ALERTS_TABLE")
}
Same pattern as the ingest Lambda—initialize once, reuse across invocations.
DynamoDB client creation is expensive; doing it in init() amortizes that cost.
The Main Handler: Routing Requests
API Gateway invokes this Lambda with an HTTP request structure:
func handler(ctx context.Context, req events.APIGatewayProxyRequest) (events.APIGatewayProxyResponse, error) {
    // CORS headers
    headers := map[string]string{
        "Content-Type":                "application/json",
        "Access-Control-Allow-Origin": "*",
        "Access-Control-Allow-Methods": "GET, POST, PUT, DELETE, OPTIONS",
        "Access-Control-Allow-Headers": "Content-Type, Authorization",
    }

    // Handle OPTIONS for CORS
    if req.HTTPMethod == "OPTIONS" {
        return events.APIGatewayProxyResponse{
            StatusCode: 200,
            Headers:    headers,
        }, nil
    }
CORS (Cross-Origin Resource Sharing) is essential for web apps calling APIs. The dashboard is served from S3/CloudFront, but it calls this API on a different domain. Without CORS headers, browsers block the requests. The OPTIONS handler supports preflight requests—a browser security check before the actual API call.
Routing to Handlers
    // Route request
    switch {
    case req.Path == "/api/devices" && req.HTTPMethod == "GET":
        return getDevices(ctx, req, headers)
    case req.Path == "/api/alerts" && req.HTTPMethod == "GET":
        return getAlerts(ctx, req, headers)
    case req.Path == "/api/events" && req.HTTPMethod == "GET":
        return getEvents(ctx, req, headers)
    case req.Path == "/api/stats" && req.HTTPMethod == "GET":
        return getStats(ctx, req, headers)
    default:
        return events.APIGatewayProxyResponse{
            StatusCode: 404,
            Headers:    headers,
            Body:       `{"error": "Not found"}`,
        }, nil
    }
}
Simple path-based routing. In production, you might use a router library, but for a handful of endpoints, a switch statement is perfectly adequate and has zero dependencies.
Getting Devices
This endpoint returns the current state of all devices at a facility:
func getDevices(ctx context.Context, req events.APIGatewayProxyRequest, headers map[string]string) (events.APIGatewayProxyResponse, error) {
    facilityID := req.QueryStringParameters["facility_id"]
    if facilityID == "" {
        facilityID = "WH001"
    }

    // Query latest heartbeat for each device
    result, err := ddbClient.Query(ctx, &dynamodb.QueryInput{
        TableName:              &eventsTable,
        IndexName:              aws.String("GSI1"),
        KeyConditionExpression: aws.String("GSI1PK = :pk AND begins_with(GSI1SK, :sk)"),
        ExpressionAttributeValues: map[string]types.AttributeValue{
            ":pk": &types.AttributeValueMemberS{Value: fmt.Sprintf("FACILITY#%s", facilityID)},
            ":sk": &types.AttributeValueMemberS{Value: "HEARTBEAT#"},
        },
        ScanIndexForward: aws.Bool(false),
        Limit:            aws.Int32(100),
    })
We’re using the Global Secondary Index to query by facility and event type.
begins_with on the sort key filters to just heartbeat events.
ScanIndexForward: false means descending order—newest first. Limit: 100 caps
how many results we retrieve (don’t accidentally pull thousands of records and
timeout the Lambda).
Deduplicating Results
    if err != nil {
        log.Printf("Query error: %v", err)
        return errorResponse(500, "Database error", headers), nil
    }

    // Process and deduplicate by device
    devices := make(map[string]map[string]interface{})
    for _, item := range result.Items {
        var record map[string]interface{}
        attributevalue.UnmarshalMap(item, &record)

        deviceID := record["device_id"].(string)
        if _, exists := devices[deviceID]; !exists {
            devices[deviceID] = record
        }
    }
We get heartbeats from all devices, but we only want the latest heartbeat per device. By iterating newest-first and using a map, the first heartbeat we see for each device is kept, and duplicates are naturally skipped.
Returning Results
    body, _ := json.Marshal(map[string]interface{}{
        "devices": devices,
        "count":   len(devices),
    })

    return events.APIGatewayProxyResponse{
        StatusCode: 200,
        Headers:    headers,
        Body:       string(body),
    }, nil
}
Package up the devices map, add a count for convenience, marshal to JSON, and return. API Gateway takes this response structure and turns it into a proper HTTP response.
Getting Alerts
Similar pattern, but querying the alerts table:
func getAlerts(ctx context.Context, req events.APIGatewayProxyRequest, headers map[string]string) (events.APIGatewayProxyResponse, error) {
    facilityID := req.QueryStringParameters["facility_id"]
    status := req.QueryStringParameters["status"]

    if facilityID == "" {
        facilityID = "WH001"
    }
    if status == "" {
        status = "PENDING"
    }

    result, err := ddbClient.Query(ctx, &dynamodb.QueryInput{
        TableName:              &alertsTable,
        KeyConditionExpression: aws.String("PK = :pk"),
        FilterExpression:       aws.String("#status = :status"),
        ExpressionAttributeNames: map[string]string{
            "#status": "status",
        },
        ExpressionAttributeValues: map[string]types.AttributeValue{
            ":pk":     &types.AttributeValueMemberS{Value: fmt.Sprintf("FACILITY#%s", facilityID)},
            ":status": &types.AttributeValueMemberS{Value: status},
        },
        ScanIndexForward: aws.Bool(false),
    })
Query by facility partition key, filter to a specific status. The #status
alias is necessary because “status” is a DynamoDB reserved word—we have to
escape it with an expression attribute name.
Processing Alert Results
    if err != nil {
        return errorResponse(500, "Database error", headers), nil
    }

    var alerts []map[string]interface{}
    for _, item := range result.Items {
        var alert map[string]interface{}
        attributevalue.UnmarshalMap(item, &alert)
        alerts = append(alerts, alert)
    }

    body, _ := json.Marshal(map[string]interface{}{
        "alerts": alerts,
        "count":  len(alerts),
    })

    return events.APIGatewayProxyResponse{
        StatusCode: 200,
        Headers:    headers,
        Body:       string(body),
    }, nil
}
Unmarshal each result into a generic map (we’re just passing through to the frontend, no need for strict typing), collect them in a slice, return as JSON.
Getting Events for a Specific Device
func getEvents(ctx context.Context, req events.APIGatewayProxyRequest, headers map[string]string) (events.APIGatewayProxyResponse, error) {
    deviceID := req.QueryStringParameters["device_id"]
    limitStr := req.QueryStringParameters["limit"]

    limit := int32(50)
    if limitStr != "" {
        if l, err := strconv.Atoi(limitStr); err == nil {
            limit = int32(l)
        }
    }

    result, err := ddbClient.Query(ctx, &dynamodb.QueryInput{
        TableName:              &eventsTable,
        KeyConditionExpression: aws.String("PK = :pk"),
        ExpressionAttributeValues: map[string]types.AttributeValue{
            ":pk": &types.AttributeValueMemberS{Value: fmt.Sprintf("DEVICE#%s", deviceID)},
        },
        ScanIndexForward: aws.Bool(false),
        Limit:            &limit,
    })
Query all events for a specific device, newest first, limited to however many the client requested (defaulting to 50). This powers the device detail view in the dashboard—when you click a cage, it shows recent activity.
Returning Events
    if err != nil {
        return errorResponse(500, "Database error", headers), nil
    }

    var evts []map[string]interface{}
    for _, item := range result.Items {
        var evt map[string]interface{}
        attributevalue.UnmarshalMap(item, &evt)
        evts = append(evts, evt)
    }

    body, _ := json.Marshal(map[string]interface{}{
        "events": evts,
        "count":  len(evts),
    })

    return events.APIGatewayProxyResponse{
        StatusCode: 200,
        Headers:    headers,
        Body:       string(body),
    }, nil
}
Same pattern: unmarshal, collect, return. The consistency makes the code predictable and easy to maintain.
Getting Statistics
func getStats(ctx context.Context, req events.APIGatewayProxyRequest, headers map[string]string) (events.APIGatewayProxyResponse, error) {
    facilityID := req.QueryStringParameters["facility_id"]
    if facilityID == "" {
        facilityID = "WH001"
    }

    // This would aggregate statistics
    // Simplified for example
    stats := map[string]interface{}{
        "facility_id":     facilityID,
        "total_devices":   45,
        "active_devices":  42,
        "pending_alerts":  3,
        "traps_triggered": 7,
        "baits_expired":   5,
    }

    body, _ := json.Marshal(stats)

    return events.APIGatewayProxyResponse{
        StatusCode: 200,
        Headers:    headers,
        Body:       string(body),
    }, nil
}
This is stubbed with hardcoded data for the article. In production, you’d query DynamoDB, count events by type, compute metrics, etc. But the structure remains the same: calculate, marshal, return.
Error Response Helper
func errorResponse(code int, msg string, headers map[string]string) events.APIGatewayProxyResponse {
    body, _ := json.Marshal(map[string]string{"error": msg})
    return events.APIGatewayProxyResponse{
        StatusCode: code,
        Headers:    headers,
        Body:       string(body),
    }
}

func main() {
    lambda.Start(handler)
}
A simple helper to construct error responses consistently. And the main()
function that starts the Lambda runtime.
ReactJS Dashboard
The dashboard is where humans interact with the system. It’s a single-page app built with React, fetching data from our API Lambda and displaying it in a clean, real-time interface.
Main Dashboard Component
Imports and Setup
// src/components/Dashboard.tsx
import React, { useState, useEffect, useCallback } from "react";
import { useQuery, useQueryClient } from "@tanstack/react-query";
import { AlertCircle, Battery, Wifi, Clock, MapPin } from "lucide-react";
import {
  fetchDevices,
  fetchAlerts,
  fetchStats,
  acknowledgeAlert,
} from "../api/client";
import DeviceGrid from "./DeviceGrid";
import AlertPanel from "./AlertPanel";
import StatsCards from "./StatsCards";
import FacilityMap from "./FacilityMap";
We’re using React Query (now TanStack Query) for data fetching—it handles caching, background refetching, and loading states automatically. Lucide React provides our icons. The imports at the bottom are our custom components—we’ll see those shortly.
Component Interface
interface DashboardProps {
  facilityId: string;
}

const Dashboard: React.FC<DashboardProps> = ({ facilityId }) => {
  const queryClient = useQueryClient();
  const [selectedDevice, setSelectedDevice] = useState<string | null>(null);
TypeScript interfaces define our props. The dashboard takes a facilityId—which
warehouse we’re viewing. queryClient lets us manually invalidate cached data
when needed. selectedDevice tracks which cage the user has clicked on for
detail view.
Fetching Data with React Query
// Fetch data with React Query
const { data: devices, isLoading: devicesLoading } = useQuery({
  queryKey: ["devices", facilityId],
  queryFn: () => fetchDevices(facilityId),
  refetchInterval: 30000, // Refresh every 30 seconds
});

const { data: alerts, isLoading: alertsLoading } = useQuery({
  queryKey: ["alerts", facilityId],
  queryFn: () => fetchAlerts(facilityId, "PENDING"),
  refetchInterval: 10000, // Refresh every 10 seconds for alerts
});

const { data: stats } = useQuery({
  queryKey: ["stats", facilityId],
  queryFn: () => fetchStats(facilityId),
  refetchInterval: 60000,
});
React Query automatically handles the lifecycle: fetch on mount, cache the
results, refetch in the background on the specified interval. queryKey
includes facilityId so changing facilities automatically triggers a new fetch.
Alerts refresh faster than devices (10s vs 30s) because they’re more
time-sensitive.
Handling Alert Acknowledgment
// Handle alert acknowledgment
const handleAcknowledgeAlert = useCallback(
  async (alertId: string) => {
    await acknowledgeAlert(alertId);
    queryClient.invalidateQueries({ queryKey: ["alerts", facilityId] });
  },
  [facilityId, queryClient]
);
When someone clicks “acknowledge” on an alert, we call the API, then invalidate
the alerts query. This triggers an immediate refetch, so the UI updates to show
the alert is resolved. useCallback memoizes the function—important when
passing callbacks to child components to prevent unnecessary re-renders.
WebSocket for Real-Time Updates
// WebSocket for real-time updates
useEffect(() => {
  const ws = new WebSocket(`wss://api.smartcage.io/ws?facility=${facilityId}`);

  ws.onmessage = (event) => {
    const message = JSON.parse(event.data);

    if (message.type === "TRAP_TRIGGERED") {
      // Play alert sound
      new Audio("/alert.mp3").play();
      // Invalidate queries to refresh data
      queryClient.invalidateQueries({ queryKey: ["devices", facilityId] });
      queryClient.invalidateQueries({ queryKey: ["alerts", facilityId] });
    }
  };

  return () => ws.close();
}, [facilityId, queryClient]);
The polling intervals (10-60 seconds) are fine for routine updates, but trap triggers need instant notification. We open a WebSocket to the backend, listen for critical events, and invalidate queries to pull fresh data. Playing an audible alert ensures operators don’t miss urgent events. The cleanup function closes the WebSocket when the component unmounts or dependencies change.
Rendering Loading State
if (devicesLoading || alertsLoading) {
  return <LoadingSpinner />;
}
While initial data loads, show a spinner. Once we have data, the component renders fully, and subsequent refetches happen in the background without disrupting the UI.
The Main Dashboard Layout
  return (
    <div className="min-h-screen bg-gray-100">
      {/* Header */}
      <header className="bg-white shadow">
        <div className="max-w-7xl mx-auto px-4 py-4 flex justify-between items-center">
          <div>
            <h1 className="text-2xl font-bold text-gray-900">Smart Cage Dashboard</h1>
            <p className="text-sm text-gray-500">Facility: {facilityId}</p>
          </div>
          <div className="flex items-center space-x-4">
            <span className="flex items-center text-green-600">
              <span className="w-2 h-2 bg-green-500 rounded-full mr-2 animate-pulse"></span>
              Live
            </span>
            <span className="text-sm text-gray-500">
              Last updated: {new Date().toLocaleTimeString()}
            </span>
          </div>
        </div>
      </header>
Tailwind CSS classes handle styling—no separate CSS files. The pulsing green dot and “Live” indicator reassure users that data is current. The timestamp shows when the page last refreshed.
Stats Overview Cards
      <main className="max-w-7xl mx-auto px-4 py-6">
        {/* Stats Overview */}
        <StatsCards stats={stats} />
We extract stats into a separate component for reusability and cleaner code. It receives the stats data as props and renders the summary cards.
Critical Alert Banner
{
  /* Alert Banner for Critical Alerts */
}
{
  alerts && alerts.length > 0 && (
    <div className="mb-6 bg-red-50 border-l-4 border-red-500 p-4 rounded">
      <div className="flex items-center">
        <AlertCircle className="h-6 w-6 text-red-500 mr-3" />
        <div>
          <h3 className="text-red-800 font-medium">
            {alerts.length} Active Alert{alerts.length > 1 ? "s" : ""}
          </h3>
          <p className="text-red-700 text-sm">Immediate attention required</p>
        </div>
      </div>
    </div>
  );
}
If there are pending alerts, show a prominent banner at the top. The red color
scheme signals urgency. Conditional rendering (alerts && alerts.length > 0)
ensures this only appears when relevant.
Main Content Grid
{
  /* Main Content Grid */
}
<div className="grid grid-cols-1 lg:grid-cols-3 gap-6">
  {/* Facility Map */}
  <div className="lg:col-span-2">
    <div className="bg-white rounded-lg shadow p-4">
      <h2 className="text-lg font-semibold mb-4 flex items-center">
        <MapPin className="mr-2 h-5 w-5" />
        Facility Overview
      </h2>
      <FacilityMap
        devices={devices}
        onDeviceClick={setSelectedDevice}
        selectedDevice={selectedDevice}
      />
    </div>
  </div>

  {/* Alerts Panel */}
  <div className="lg:col-span-1">
    <AlertPanel alerts={alerts || []} onAcknowledge={handleAcknowledgeAlert} />
  </div>
</div>;
Responsive grid: on large screens (lg:), the map takes 2 columns and the alerts panel 1. On smaller screens, they stack vertically. Each major section is a separate component, keeping concerns separated.
Device Grid
        {/* Device Grid */}
        <div className="mt-6">
          <DeviceGrid
            devices={devices || {}}
            selectedDevice={selectedDevice}
            onDeviceSelect={setSelectedDevice}
          />
        </div>
      </main>
    </div>
  );
};
Below the map, we show all devices in a grid. Clicking one updates
selectedDevice, which highlights it on the map and shows details.
Stats Cards Component
// Stats Cards Component
const StatsCards: React.FC<{ stats: any }> = ({ stats }) => {
  if (!stats) return null;

  const cards = [
    {
      label: 'Total Devices',
      value: stats.total_devices,
      icon: <Wifi className="h-8 w-8 text-blue-500" />,
      color: 'bg-blue-50'
    },
    {
      label: 'Active Devices',
      value: stats.active_devices,
      icon: <Battery className="h-8 w-8 text-green-500" />,
      color: 'bg-green-50'
    },
    {
      label: 'Traps Triggered',
      value: stats.traps_triggered,
      icon: <AlertCircle className="h-8 w-8 text-red-500" />,
      color: 'bg-red-50'
    },
    {
      label: 'Baits Expiring',
      value: stats.baits_expired,
      icon: <Clock className="h-8 w-8 text-orange-500" />,
      color: 'bg-orange-50'
    },
  ];
We define the card configuration as an array of objects. Each has a label, value (from stats), icon, and background color. This data-driven approach makes it easy to add or reorder cards.
Rendering Cards
  return (
    <div className="grid grid-cols-2 md:grid-cols-4 gap-4 mb-6">
      {cards.map((card, idx) => (
        <div key={idx} className={`${card.color} rounded-lg p-4`}>
          <div className="flex justify-between items-start">
            <div>
              <p className="text-sm text-gray-600">{card.label}</p>
              <p className="text-3xl font-bold mt-1">{card.value}</p>
            </div>
            {card.icon}
          </div>
        </div>
      ))}
    </div>
  );
};
Map over the cards array, rendering each one with its specific styling. Responsive grid: 2 columns on mobile, 4 on medium and larger screens. Icons positioned in the top-right corner for visual interest.
Loading Spinner
const LoadingSpinner = () => (
  <div className="min-h-screen flex items-center justify-center">
    <div className="animate-spin rounded-full h-12 w-12 border-b-2 border-blue-500"></div>
  </div>
);

export default Dashboard;
Simple, centered spinner using Tailwind’s animate-spin. Full viewport height
(min-h-screen) with flexbox centering ensures it’s prominent and centered.
Device Card Component
Each cage gets its own card showing status and metrics:
Imports and Interface
// src/components/DeviceCard.tsx
import React from "react";
import { Battery, Wifi, Clock, AlertTriangle, CheckCircle } from "lucide-react";

interface Device {
  device_id: string;
  zone: string;
  trap_status: "ARMED" | "TRIGGERED";
  battery_level: number;
  wifi_rssi: number;
  last_bait_refresh: number;
  motion_count: number;
  timestamp: number;
}

interface DeviceCardProps {
  device: Device;
  isSelected: boolean;
  onClick: () => void;
}
TypeScript interfaces ensure type safety. The Device interface matches our
backend data structure. DeviceCardProps defines what gets passed to this
component.
Computing Derived State
const DeviceCard: React.FC<DeviceCardProps> = ({ device, isSelected, onClick }) => {
  const isTriggered = device.trap_status === 'TRIGGERED';
  const batteryLow = device.battery_level < 20;
  const baitAge = Date.now() - device.last_bait_refresh;
  const baitExpired = baitAge > 7 * 24 * 60 * 60 * 1000; // 7 days
  const lastSeen = Date.now() - device.timestamp;
  const isOffline = lastSeen > 10 * 60 * 1000; // 10 minutes
Before rendering, we compute all the conditions we care about. This keeps the JSX clean—we can use readable boolean names instead of complex expressions in the template.
Dynamic Styling Based on Status
const getStatusColor = () => {
  if (isTriggered) return "border-red-500 bg-red-50";
  if (isOffline) return "border-gray-400 bg-gray-50";
  if (batteryLow || baitExpired) return "border-orange-500 bg-orange-50";
  return "border-green-500 bg-green-50";
};

const getBatteryColor = () => {
  if (device.battery_level > 50) return "text-green-500";
  if (device.battery_level > 20) return "text-yellow-500";
  return "text-red-500";
};
Functions that return Tailwind classes based on device state. Priority matters: a triggered trap gets red styling even if the battery is also low. These functions centralize the styling logic rather than scattering conditionals throughout the JSX.
WiFi Signal Strength
const getSignalBars = () => {
  const rssi = device.wifi_rssi;
  if (rssi > -50) return 4;
  if (rssi > -60) return 3;
  if (rssi > -70) return 2;
  return 1;
};
RSSI (Received Signal Strength Indicator) is measured in negative dBm. Less negative is better: -30 is excellent, -90 is terrible. We map ranges to 1-4 bars for a familiar visual representation.
Time Formatting
const formatTimeAgo = (ms: number) => {
  const minutes = Math.floor(ms / 60000);
  if (minutes < 60) return `${minutes}m ago`;
  const hours = Math.floor(minutes / 60);
  if (hours < 24) return `${hours}h ago`;
  return `${Math.floor(hours / 24)}d ago`;
};
Convert milliseconds to human-readable relative time. “2m ago” is more meaningful than “120000ms ago” or even an absolute timestamp. This function makes the UI feel more natural.
The Card Structure
  return (
    <div
      onClick={onClick}
      className={`
        p-4 rounded-lg border-2 cursor-pointer transition-all
        ${getStatusColor()}
        ${isSelected ? 'ring-2 ring-blue-500 ring-offset-2' : ''}
        hover:shadow-md
      `}
    >
The card is clickable (cursor-pointer), has dynamic coloring based on status,
and gains a blue ring when selected. The transition-all makes hover effects
smooth. Template literals with ${} embed our computed classes.
Card Header
{
  /* Header */
}
<div className="flex justify-between items-start mb-3">
  <div>
    <h3 className="font-semibold text-gray-900">{device.device_id}</h3>
    <p className="text-sm text-gray-500">Zone {device.zone}</p>
  </div>
  {isTriggered ? (
    <AlertTriangle className="h-6 w-6 text-red-500 animate-pulse" />
  ) : (
    <CheckCircle className="h-6 w-6 text-green-500" />
  )}
</div>;
Device ID and zone on the left, status icon on the right. The pulsing alert triangle for triggered traps draws immediate attention. Conditional rendering with ternary operator keeps it concise.
Status Badge
{
  /* Status Badge */
}
<div
  className={`
        inline-block px-2 py-1 rounded text-xs font-medium mb-3
        ${
          isTriggered
            ? "bg-red-200 text-red-800"
            : "bg-green-200 text-green-800"
        }
      `}>
  {device.trap_status}
</div>;
A colored badge showing ARMED or TRIGGERED. The inline-block display makes it just wide enough for its content, and the contrasting text/background colors ensure readability.
Metrics Section
      {/* Metrics */}
      <div className="space-y-2 text-sm">
        {/* Battery */}
        <div className="flex items-center justify-between">
          <span className="flex items-center text-gray-600">
            <Battery className={`h-4 w-4 mr-1 ${getBatteryColor()}`} />
            Battery
          </span>
          <span className={getBatteryColor()}>
            {device.battery_level.toFixed(0)}%
          </span>
        </div>
Icon and label on the left, value on the right. The battery icon changes color
based on charge level—green when healthy, yellow when getting low, red when
critical. space-y-2 adds consistent vertical spacing between metrics.
WiFi Signal Visualization
{
  /* Signal */
}
<div className="flex items-center justify-between">
  <span className="flex items-center text-gray-600">
    <Wifi className="h-4 w-4 mr-1" />
    Signal
  </span>
  <div className="flex space-x-0.5">
    {[1, 2, 3, 4].map((bar) => (
      <div
        key={bar}
        className={`w-1 rounded-sm ${
          bar <= getSignalBars() ? "bg-green-500" : "bg-gray-300"
        }`}
        style={{ height: `${bar * 4}px` }}
      />
    ))}
  </div>
</div>;
Four vertical bars of increasing height representing signal strength. Bars up to the current signal level are green; the rest are gray. This mimics the familiar WiFi indicator on phones and laptops.
Bait Age Indicator
{
  /* Last Bait Refresh */
}
<div className="flex items-center justify-between">
  <span className="flex items-center text-gray-600">
    <Clock className="h-4 w-4 mr-1" />
    Bait Age
  </span>
  <span className={baitExpired ? "text-red-500 font-medium" : ""}>
    {formatTimeAgo(baitAge)}
  </span>
</div>;
Shows how long since bait was refreshed. If expired (>7 days), highlight in red with bold text. Otherwise, display normally. This draws attention to maintenance needs.
Motion Event Count
        {/* Motion Count */}
        <div className="flex items-center justify-between">
          <span className="text-gray-600">Motion Events</span>
          <span>{device.motion_count}</span>
        </div>
      </div>
Simple counter of motion events since last reset. Higher numbers indicate more activity—useful for identifying hotspots.
Last Seen Timestamp
      {/* Last Seen */}
      <div className="mt-3 pt-3 border-t border-gray-200">
        <p className={`text-xs ${isOffline ? 'text-red-500' : 'text-gray-400'}`}>
          {isOffline ? '⚠️ Offline - ' : ''}
          Last seen: {formatTimeAgo(lastSeen)}
        </p>
      </div>
    </div>
  );
};

export default DeviceCard;
Separated by a top border to visually distinguish it. If the device hasn’t reported in 10+ minutes, show an offline warning. This helps operators quickly identify connectivity issues.
API Client
The glue between React and our backend:
Configuration and Helper
// src/api/client.ts
const API_BASE = process.env.REACT_APP_API_URL || "https://api.smartcage.io";

interface ApiResponse<T> {
  data: T;
  error?: string;
}

async function apiCall<T>(endpoint: string, options?: RequestInit): Promise<T> {
  const response = await fetch(`${API_BASE}${endpoint}`, {
    ...options,
    headers: {
      "Content-Type": "application/json",
      ...options?.headers,
    },
  });

  if (!response.ok) {
    throw new Error(`API Error: ${response.statusText}`);
  }

  return response.json();
}
Generic apiCall function handles the common patterns: construct full URL, set
JSON content type, throw on HTTP errors, parse JSON response. TypeScript
generics (<T>) let us type the return value based on what we’re fetching.
Fetching Devices
export async function fetchDevices(facilityId: string) {
  const response = await apiCall<{
    devices: Record<string, any>;
    count: number;
  }>(`/api/devices?facility_id=${facilityId}`);
  return response.devices;
}
Calls the API, extracts just the devices object from the response (discarding
count), returns it. React Query will cache this by facility ID.
Fetching Alerts
export async function fetchAlerts(facilityId: string, status: string) {
  const response = await apiCall<{ alerts: any[]; count: number }>(
    `/api/alerts?facility_id=${facilityId}&status=${status}`
  );
  return response.alerts;
}
Similar pattern—call API, extract relevant data. The status parameter lets us
filter to PENDING, ACKNOWLEDGED, or ALL.
Other Read Operations
export async function fetchStats(facilityId: string) {
  return apiCall<any>(`/api/stats?facility_id=${facilityId}`);
}

export async function fetchDeviceEvents(deviceId: string, limit = 50) {
  const response = await apiCall<{ events: any[]; count: number }>(
    `/api/events?device_id=${deviceId}&limit=${limit}`
  );
  return response.events;
}
fetchStats returns the whole response (it’s already a simple object).
fetchDeviceEvents accepts a limit parameter for pagination control.
Write Operations
export async function acknowledgeAlert(alertId: string) {
  return apiCall(`/api/alerts/${alertId}/acknowledge`, {
    method: "POST",
  });
}

export async function refreshBait(deviceId: string) {
  return apiCall(`/api/devices/${deviceId}/actions`, {
    method: "POST",
    body: JSON.stringify({ action: "refresh_bait" }),
  });
}

export async function resetTrap(deviceId: string) {
  return apiCall(`/api/devices/${deviceId}/actions`, {
    method: "POST",
    body: JSON.stringify({ action: "reset_trap" }),
  });
}
POST requests for actions. These trigger backend operations—acknowledging an alert updates its status, refreshing bait records the timestamp, resetting a trap clears its triggered state.
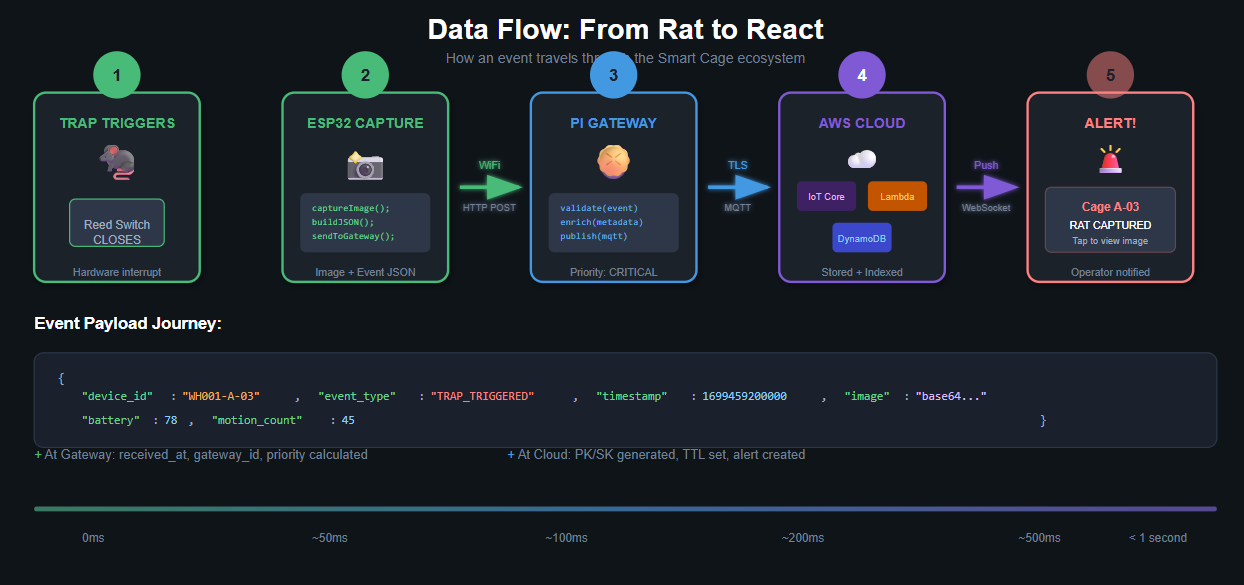
Pitfalls & Mitigation Strategies
Building and operating an IoT system at scale comes with significant challenges. Here are the key pitfalls we’ve encountered and how to address them:
1. Network Reliability Issues
The Problem: WiFi connectivity in large metal warehouses is notoriously unreliable. Signal reflections, dead zones, and interference from industrial equipment can cause frequent disconnections.
Mitigation Strategies:
- Implement aggressive local buffering on ESP32 devices. Store up to 100 events in flash memory when connectivity is lost.
- Use multiple Raspberry Pi gateways per facility for redundancy and better coverage.
- Consider mesh networking with ESP-NOW for device-to-device relay.
- Monitor WiFi RSSI and proactively alert when signal quality degrades.
// Local event buffer on gateway
type EventBuffer struct {
    events []DeviceEvent
    maxSize int
    mu sync.Mutex
}

func (b *EventBuffer) Store(evt DeviceEvent) {
    b.mu.Lock()
    defer b.mu.Unlock()

    if len(b.events) >= b.maxSize {
        // Evict oldest, but preserve critical events
        b.evictNonCritical()
    }
    b.events = append(b.events, evt)
}
2. Power Management
The Problem: Battery-powered devices in hard-to-reach locations can fail silently. Replacing batteries across hundreds of cages is operationally expensive.
Mitigation Strategies:
- Implement aggressive sleep modes, waking only on interrupt or scheduled intervals.
- Use low-battery alerts with sufficient lead time (warn at 30%, critical at 15%).
- Consider solar charging for cages near windows or outdoors.
- Track battery drain patterns to predict failures before they happen.
3. False Positives and Sensor Drift
The Problem: PIR sensors can trigger on temperature changes, dust, or insects. Reed switches can corrode or misalign over time.
Mitigation Strategies:
- Implement confidence scoring based on multiple sensor inputs.
- Use camera verification for trap trigger events before alerting.
- Track sensor patterns and flag devices showing anomalous behavior.
- Schedule periodic calibration checks during maintenance rounds.
// Confidence scoring for trap events
func (p *Processor) calculateConfidence(evt DeviceEvent) float64 {
    confidence := 0.5 // Base confidence

    // Reed switch triggered
    if evt.TrapStatus == "TRIGGERED" {
        confidence += 0.3
    }

    // Recent motion detected
    if evt.MotionCount > 0 && time.Since(lastMotion) < time.Minute {
        confidence += 0.15
    }

    // Image captured and verified
    if evt.ImageData != "" {
        confidence += 0.05
        // ML model could add more confidence here
    }

    return math.Min(confidence, 1.0)
}
4. Data Volume and Cost Management
The Problem: Motion events can generate massive data volumes. Storing every event indefinitely becomes expensive.
Mitigation Strategies:
- Aggregate motion events at the edge (report counts, not individual events).
- Use DynamoDB TTL for automatic data expiration.
- Implement tiered storage: hot data in DynamoDB, cold data in S3 Glacier.
- Set appropriate data retention policies based on business requirements.
5. Security Vulnerabilities
The Problem: IoT devices are notoriously insecure. Compromised devices could be used for DDoS attacks or to gain network access.
Mitigation Strategies:
- Use unique certificates per device for AWS IoT authentication.
- Implement network segmentation—cage devices cannot reach the internet directly.
- Regularly rotate credentials and update firmware.
- Monitor for anomalous traffic patterns.
# AWS IoT Policy - Principle of least privilege
{
  "Version": "2012-10-17",
  "Statement":
    [
      {
        "Effect": "Allow",
        "Action": "iot:Connect",
        "Resource": "arn:aws:iot:region:account:client/${iot:ClientId}",
      },
      {
        "Effect": "Allow",
        "Action": "iot:Publish",
        "Resource": "arn:aws:iot:region:account:topic/smartcage/${iot:ClientId}/*",
      },
    ],
}
6. Firmware Update Challenges
The Problem: Updating firmware on hundreds of deployed devices is risky. A bad update can brick devices in inaccessible locations.
Mitigation Strategies:
- Implement OTA updates with rollback capability.
- Use A/B partition schemes for safe updates.
- Roll out updates gradually (canary deployments).
- Maintain version tracking and compatibility matrices.
7. Clock Drift and Time Synchronization
The Problem: ESP32 devices lack real-time clocks. Time drift can cause event ordering issues and make debugging difficult.
Mitigation Strategies:
- Sync device time with gateway on every heartbeat.
- Use relative timestamps (milliseconds since boot) with gateway-assigned absolute times.
- Implement NTP on the Raspberry Pi gateway.
- Store both device timestamp and server timestamp for all events.
8. Gateway Single Point of Failure
The Problem: If the Raspberry Pi fails, all connected cages lose connectivity.
Mitigation Strategies:
- Deploy multiple gateways with overlapping coverage.
- Implement gateway health monitoring with automatic alerting.
- Use systemd watchdog for automatic restart on crash.
- Keep cold spare gateways pre-configured and ready.
Conclusion
Smart Cage demonstrates how modern IoT technologies can transform traditional industrial operations. By combining edge computing with serverless cloud architecture, we’ve created a scalable, cost-effective solution for intelligent pest management.
Key Takeaways:
The edge-first architecture is crucial. Processing data locally reduces bandwidth costs, improves response times, and enables operation during connectivity outages.
GoLang proved to be an excellent choice for both edge and cloud components. Its single-binary deployment, low resource footprint, and excellent concurrency support make it ideal for IoT applications.
The serverless approach with AWS eliminates operational overhead while providing automatic scaling. The pay-per-use model is particularly cost-effective for event-driven IoT workloads.
However, IoT systems require careful attention to failure modes. Network reliability, power management, and security must be designed in from the start—they cannot be bolted on later.
The real value of Smart Cage isn’t just in trap monitoring—it’s in the data. Over time, the system builds a rich dataset of pest activity patterns that can drive predictive analytics and optimize trap placement.
Future Enhancements:
We’re exploring machine learning for image-based pest identification and activity prediction. Integration with building management systems could enable automatic responses like targeted HVAC adjustments to deter pests. And expanding beyond rat traps to a comprehensive facility monitoring platform opens exciting possibilities.
The warehouse of the future isn’t just smart—it’s proactively defensive against the oldest enemy of stored goods.