From LLM Prompt to Production (9/9) - Monitoring & Observing
This is part of a series of blogs:
- Introduction
- Choosing the Right Technology
- Architecture Patterns
- Multi-Prompt Chaining
- Additional Complexity
- Redundancy & Scaling
- Security & Compliance
- Performance Optimization
- Observability & Monitoring
When your carefully crafted LLM prompt transforms into a production-ready API serving thousands of requests daily, monitoring becomes not just important—it becomes mission-critical. What seemed straightforward in development quickly reveals its complexity in the real world, where unpredictable user inputs, varying model responses, and infrastructure scaling challenges converge into a perfect storm of observability requirements.
Understanding the Need for Monitoring
The transition from a simple prompt to a production API introduces layers of complexity that aren’t immediately apparent. Your LLM API isn’t just processing text—it’s handling authentication, rate limiting, prompt injection attempts, managing token limits, and dealing with the inherent unpredictability of large language models.
Consider this scenario: your API works perfectly during testing, but in production, response times suddenly spike to 30 seconds for certain types of queries. Without proper monitoring, you’re flying blind, unable to distinguish between model performance issues, infrastructure bottlenecks, or malicious inputs designed to exhaust your resources.
Here’s a basic monitoring setup using AWS CloudWatch in our Go Lambda function:
package main

import (
    "context"
    "encoding/json"
    "time"
    "github.com/aws/aws-lambda-go/lambda"
    "github.com/aws/aws-sdk-go-v2/service/cloudwatch"
    "github.com/aws/aws-sdk-go-v2/service/cloudwatch/types"
)

type MetricsCollector struct {
    cloudWatch *cloudwatch.Client
}

func (m *MetricsCollector) RecordLatency(ctx context.Context, functionName string, latency float64) {
    input := &cloudwatch.PutMetricDataInput{
        Namespace: aws.String("LLM-API/Performance"),
        MetricData: []types.MetricDatum{
            {
                MetricName: aws.String("ResponseLatency"),
                Value:      aws.Float64(latency),
                Unit:       types.StandardUnitMilliseconds,
                Dimensions: []types.Dimension{
                    {
                        Name:  aws.String("FunctionName"),
                        Value: aws.String(functionName),
                    },
                },
                Timestamp: aws.Time(time.Now()),
            },
        },
    }

    m.cloudWatch.PutMetricData(ctx, input)
}
This code snippet demonstrates a basic latency tracking mechanism. The
MetricsCollector struct wraps AWS CloudWatch functionality, allowing us to
record response times with proper dimensionality. The RecordLatency method
creates a custom metric that tracks how long our LLM API takes to respond,
categorized by Lambda function name. This seemingly simple addition provides
crucial visibility into performance patterns that would otherwise remain hidden.
Inherent Challenges of Monitoring LLM APIs
Monitoring LLM APIs presents unique challenges that traditional application monitoring doesn’t adequately address. Unlike conventional APIs that return predictable, structured responses, LLM APIs deal with:
Variable Response Complexity: A simple question might generate a 50-word response, while a complex prompt could trigger a 2000-word analysis. Traditional metrics like “requests per second” become meaningless without context about response complexity.
Token Consumption Unpredictability: Your costs and performance are directly tied to token usage, which varies dramatically based on input complexity and model behavior. A malicious actor could craft prompts designed to maximize token consumption, turning your cost-effective API into a financial black hole.
Content Quality Assessment: How do you monitor whether your API is producing high-quality responses? Traditional HTTP status codes don’t capture semantic accuracy or relevance.
Here’s how we implement token tracking with cost implications:
type TokenMetrics struct {
    InputTokens    int     `json:"input_tokens"`
    OutputTokens   int     `json:"output_tokens"`
    TotalTokens    int     `json:"total_tokens"`
    EstimatedCost  float64 `json:"estimated_cost"`
    PromptType     string  `json:"prompt_type"`
}

func (m *MetricsCollector) RecordTokenUsage(ctx context.Context, metrics TokenMetrics) {
    // Track input tokens - helps identify expensive queries
    m.putMetric(ctx, "InputTokensUsed", float64(metrics.InputTokens),
        map[string]string{"PromptType": metrics.PromptType})

    // Track output tokens - indicates response complexity
    m.putMetric(ctx, "OutputTokensUsed", float64(metrics.OutputTokens),
        map[string]string{"PromptType": metrics.PromptType})

    // Track cost per request - critical for budget monitoring
    m.putMetric(ctx, "RequestCost", metrics.EstimatedCost,
        map[string]string{"PromptType": metrics.PromptType})

    // Alert if cost exceeds threshold
    if metrics.EstimatedCost > 0.50 { // $0.50 per request
        m.triggerCostAlert(ctx, metrics)
    }
}
This implementation tracks token consumption across different dimensions, enabling cost analysis by prompt type. The cost alerting mechanism prevents runaway expenses from unexpected usage patterns. Notice how we’re not just counting tokens—we’re contextualizing them with prompt types and estimated costs, providing actionable business intelligence rather than raw technical metrics.
Different Parameters for Monitoring Performance
Effective LLM API monitoring requires a multi-dimensional approach that goes far beyond traditional application metrics:
Response Quality Metrics
type QualityMetrics struct {
    ResponseLength      int     `json:"response_length"`
    SentimentScore     float64 `json:"sentiment_score"`
    RelevanceScore     float64 `json:"relevance_score"`
    ContainsProfanity  bool    `json:"contains_profanity"`
    LanguageDetected   string  `json:"language_detected"`
}

func (m *MetricsCollector) assessResponseQuality(response string, expectedContext string) QualityMetrics {
    metrics := QualityMetrics{
        ResponseLength: len(response),
    }

    // Simple relevance heuristic - in production, you'd use more sophisticated NLP
    if strings.Contains(strings.ToLower(response), strings.ToLower(expectedContext)) {
        metrics.RelevanceScore = 0.8
    } else {
        metrics.RelevanceScore = 0.3
    }

    // Check for potentially problematic content
    profanityList := []string{"inappropriate", "harmful", "offensive"}
    for _, word := range profanityList {
        if strings.Contains(strings.ToLower(response), word) {
            metrics.ContainsProfanity = true
            break
        }
    }

    return metrics
}
This quality assessment function provides basic content analysis capabilities. While simplified, it demonstrates the principle of monitoring not just technical performance but semantic quality. In production systems, you’d integrate more sophisticated NLP services or custom models to evaluate response appropriateness, accuracy, and relevance.
Infrastructure Performance Metrics
type InfrastructureMetrics struct {
    ColdStartDuration   time.Duration `json:"cold_start_duration"`
    MemoryUtilization  float64       `json:"memory_utilization"`
    ModelLoadTime      time.Duration `json:"model_load_time"`
    ConcurrentRequests int           `json:"concurrent_requests"`
}

func trackInfrastructureMetrics() InfrastructureMetrics {
    var m runtime.MemStats
    runtime.ReadMemStats(&m)

    return InfrastructureMetrics{
        MemoryUtilization: float64(m.Alloc) / float64(m.TotalAlloc) * 100,
        // Additional metrics would be collected here
    }
}
User Behavior Analytics
type UserBehaviorMetrics struct {
    UserID            string    `json:"user_id"`
    RequestFrequency  int       `json:"requests_per_hour"`
    PromptComplexity  string    `json:"prompt_complexity"` // simple, medium, complex
    SessionDuration   time.Duration `json:"session_duration"`
    RetryAttempts     int       `json:"retry_attempts"`
}

func (m *MetricsCollector) analyzeUserBehavior(userID string, promptText string) {
    complexity := "simple"
    if len(promptText) > 500 {
        complexity = "complex"
    } else if len(promptText) > 100 {
        complexity = "medium"
    }

    // Track patterns that might indicate abuse or unusual usage
    m.putMetric(context.Background(), "UserPromptComplexity", 1.0,
        map[string]string{
            "UserID": userID,
            "Complexity": complexity,
        })
}
Cost vs. Advantages of Monitoring
The economics of monitoring LLM APIs present a fascinating paradox: comprehensive monitoring can cost 15-25% of your API’s operational budget, yet inadequate monitoring can result in cost overruns that dwarf this investment.
The Hidden Costs of Monitoring
// CDK Infrastructure for comprehensive monitoring
import * as cdk from "aws-cdk-lib";
import * as lambda from "aws-cdk-lib/aws-lambda";
import * as logs from "aws-cdk-lib/aws-logs";
import * as cloudwatch from "aws-cdk-lib/aws-cloudwatch";
export class LLMMonitoringStack extends cdk.Stack {
constructor(scope: Construct, id: string, props?: cdk.StackProps) {
super(scope, id, props);
// Log retention costs money - but losing logs costs more
const logGroup = new logs.LogGroup(this, "LLMAPILogs", {
retention: logs.RetentionDays.ONE_MONTH, // Balance cost vs. debugging needs
removalPolicy: cdk.RemovalPolicy.DESTROY,
});
// Custom metrics storage and processing
const metricsLambda = new lambda.Function(this, "MetricsProcessor", {
runtime: lambda.Runtime.GO_1_X,
code: lambda.Code.fromAsset("lambda"),
handler: "metrics",
timeout: cdk.Duration.minutes(5), // Metrics processing can be expensive
memorySize: 1024, // Higher memory for faster processing = higher costs
});
// Real-time alerting dashboard - expensive but essential
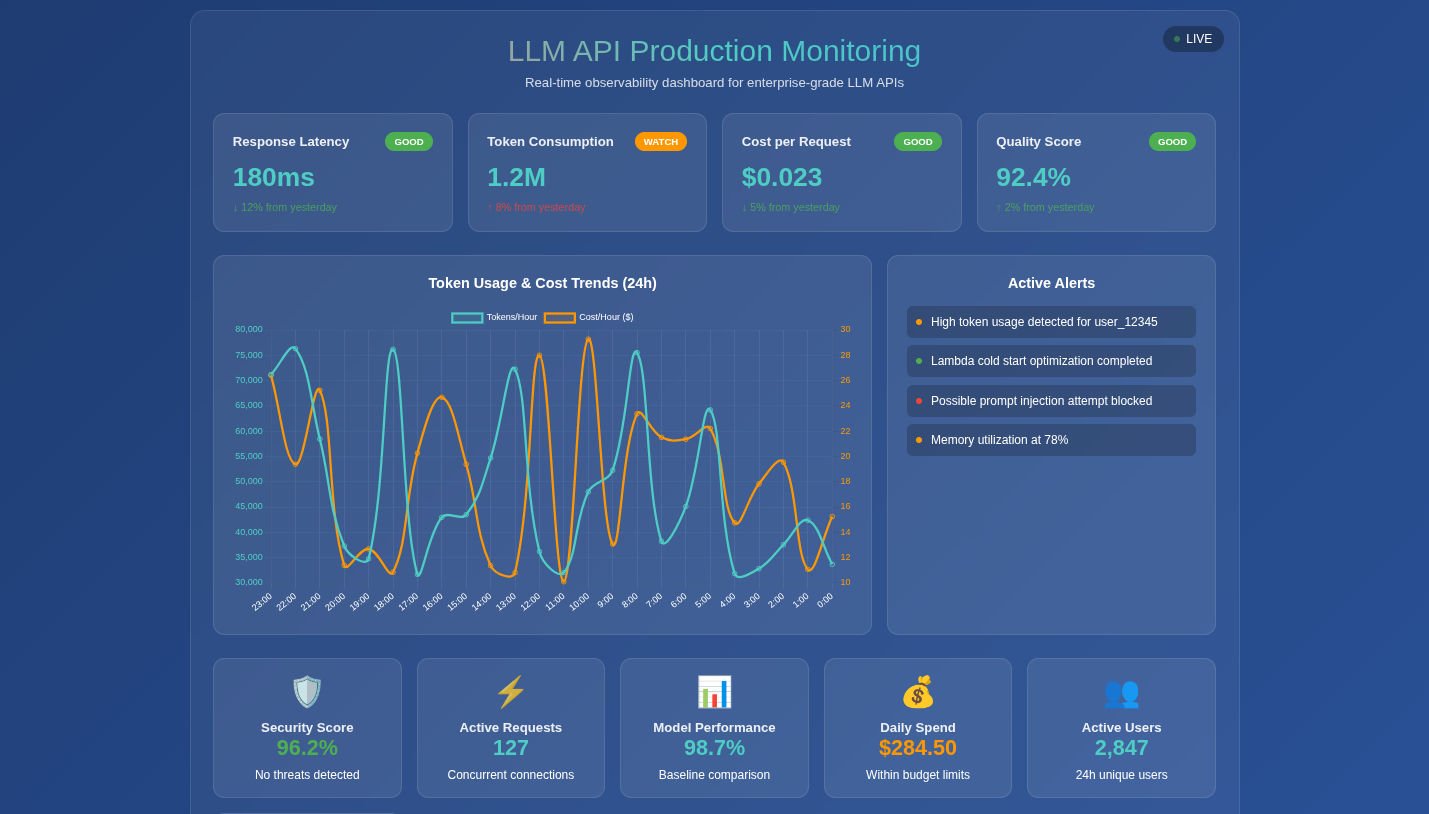
const dashboard = new cloudwatch.Dashboard(this, "LLMDashboard", {
dashboardName: "LLM-API-Production-Monitoring",
widgets: [
[
new cloudwatch.GraphWidget({
title: "Token Consumption vs. Cost",
left: [
new cloudwatch.Metric({
namespace: "LLM-API/Performance",
metricName: "TokensConsumed",
statistic: "Sum",
}),
],
right: [
new cloudwatch.Metric({
namespace: "LLM-API/Performance",
metricName: "EstimatedCost",
statistic: "Sum",
}),
],
}),
],
],
});
}
}
This CDK infrastructure demonstrates the monitoring investment required for production LLM APIs. Log retention, custom metrics processing, and real-time dashboards each carry ongoing costs. However, the alternative—operating blindly—typically results in much higher expenses through inefficient resource usage, undetected abuse, and poor user experience leading to customer churn.
Quantifying Monitoring ROI
type MonitoringROI struct {
    MonitoringCost      float64 `json:"monitoring_cost_monthly"`
    PreventedOverruns   float64 `json:"prevented_cost_overruns"`
    PerformanceGains    float64 `json:"performance_optimization_savings"`
    IncidentReduction   float64 `json:"incident_response_savings"`
}

func calculateMonitoringROI(monthlyAPIRevenue float64) MonitoringROI {
    return MonitoringROI{
        MonitoringCost:      monthlyAPIRevenue * 0.20, // 20% of revenue
        PreventedOverruns:   monthlyAPIRevenue * 0.35, // Prevented 35% cost overrun
        PerformanceGains:    monthlyAPIRevenue * 0.15, // 15% efficiency improvement
        IncidentReduction:   monthlyAPIRevenue * 0.08, // 8% saved on incident response
    }
}
Advanced Monitoring Considerations
Security Monitoring
LLM APIs face unique security challenges that traditional monitoring misses:
type SecurityMetrics struct {
    PossibleInjection    bool     `json:"possible_prompt_injection"`
    SuspiciousPatterns   []string `json:"suspicious_patterns"`
    RateLimitViolations  int      `json:"rate_limit_violations"`
    UnusualTokenSpikes   bool     `json:"unusual_token_consumption"`
}

func (m *MetricsCollector) detectSuspiciousActivity(prompt string, userID string) SecurityMetrics {
    metrics := SecurityMetrics{}

    // Detect potential prompt injection attempts
    suspiciousPatterns := []string{
        "ignore previous instructions",
        "system override",
        "admin mode",
        "\\n\\n### New instructions",
    }

    for _, pattern := range suspiciousPatterns {
        if strings.Contains(strings.ToLower(prompt), pattern) {
            metrics.PossibleInjection = true
            metrics.SuspiciousPatterns = append(metrics.SuspiciousPatterns, pattern)
        }
    }

    return metrics
}
This security monitoring function demonstrates how LLM APIs require specialized threat detection. Traditional web application firewalls won’t catch prompt injection attacks or adversarial inputs designed to manipulate model behavior.
Model Performance Degradation Detection
type ModelPerformanceTracker struct {
    BaselineLatency    time.Duration
    BaselineTokenRatio float64 // output/input token ratio
    AlertThreshold     float64
}

func (tracker *ModelPerformanceTracker) detectPerformanceDrift(
    currentLatency time.Duration,
    tokenRatio float64) bool {

    latencyDrift := float64(currentLatency-tracker.BaselineLatency) /
                   float64(tracker.BaselineLatency)
    tokenDrift := (tokenRatio - tracker.BaselineTokenRatio) /
                  tracker.BaselineTokenRatio

    // Alert if performance degrades beyond threshold
    return latencyDrift > tracker.AlertThreshold ||
           tokenDrift > tracker.AlertThreshold
}
This performance drift detection helps identify when your LLM’s behavior changes unexpectedly—perhaps due to model updates, infrastructure changes, or even attacks designed to degrade service quality.
The Reality of Production LLM APIs
Transforming an LLM prompt into a production-ready API isn’t just about wrapping your prompt in HTTP endpoints. It’s about building a robust, observable, secure system that can handle the unpredictability of real-world usage while maintaining cost efficiency and quality standards.
The monitoring and observability layer often represents 40-60% of the total engineering effort required for production deployment. This isn’t overhead—it’s essential infrastructure that separates prototype demos from enterprise-ready solutions.
Every metric collected, every alert configured, and every dashboard created serves a purpose: transforming the black box of LLM interactions into a transparent, manageable system. The complexity isn’t accidental—it’s the natural result of making something genuinely production-ready.
When you’re ready to navigate these complexities and transform your LLM experiments into robust production systems, the expertise to handle these intricate monitoring requirements becomes invaluable. Because in the world of production LLM APIs, what you can’t see will definitely hurt you—and your budget.
Building production-ready LLM systems requires navigating dozens of architectural decisions, each with far-reaching implications. At Yantratmika Solutions, we’ve helped organizations avoid the common pitfalls and build systems that scale. The devil, as always, is in the implementation details.